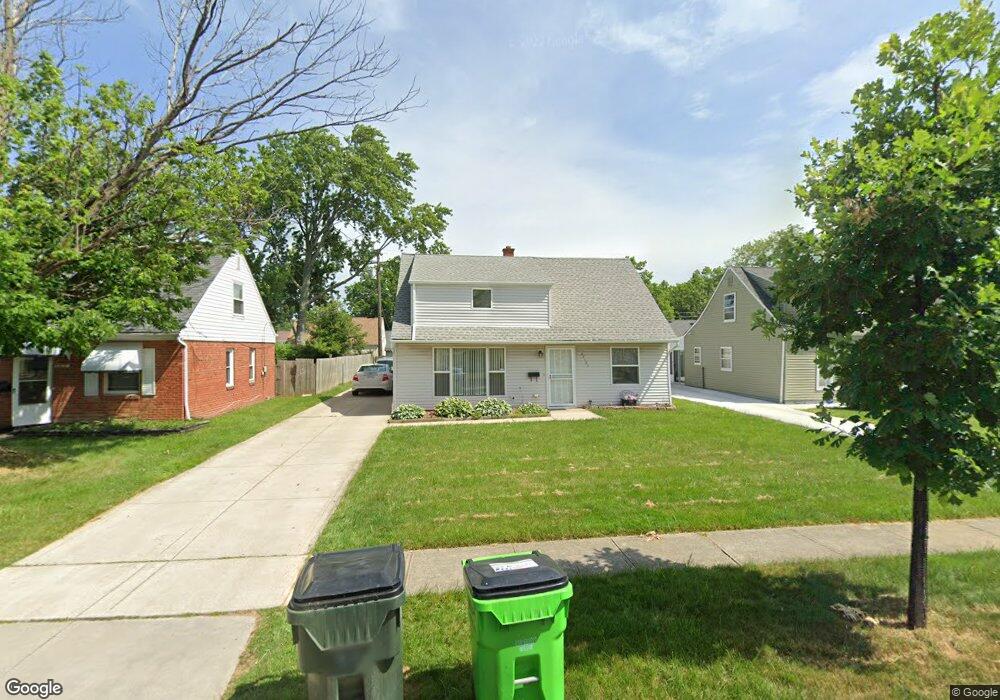
27101 Shirley Ave Euclid, OH 44132
Estimated Value: $144,154 - $159,000
4
Beds
1
Bath
1,581
Sq Ft
$96/Sq Ft
Est. Value
About This Home
This home is located at 27101 Shirley Ave, Euclid, OH 44132 and is currently estimated at $151,289, approximately $95 per square foot. 27101 Shirley Ave is a home located in Cuyahoga County with nearby schools including Shoreview Elementary School, Euclid High School, and Ss. Robert & William Catholic School.
Ownership History
Date
Name
Owned For
Owner Type
Purchase Details
Closed on
Jul 20, 2010
Sold by
Aurora Loan Services Llc
Bought by
Lee Amy C
Current Estimated Value
Purchase Details
Closed on
Apr 15, 2010
Sold by
Dinunzio Andrew Joseph
Bought by
Aurora Loan Services Llc
Purchase Details
Closed on
Jun 30, 2006
Sold by
Underkofler Richard L
Bought by
Dinunzio Andrew Joseph
Purchase Details
Closed on
Apr 6, 1997
Sold by
Estok Elaine and Caspell Barbara
Bought by
Underkofler Richard L
Purchase Details
Closed on
May 23, 1990
Sold by
Underkofler Ida Mae
Bought by
Estok Elaine
Purchase Details
Closed on
May 23, 1978
Sold by
Coghill Barbara A
Bought by
Underkofler Ida Mae
Purchase Details
Closed on
Jan 1, 1975
Bought by
Coghill Barbara A
Create a Home Valuation Report for This Property
The Home Valuation Report is an in-depth analysis detailing your home's value as well as a comparison with similar homes in the area
Home Values in the Area
Average Home Value in this Area
Purchase History
| Date | Buyer | Sale Price | Title Company |
|---|---|---|---|
| Lee Amy C | $29,000 | Sovereign Title | |
| Aurora Loan Services Llc | $43,334 | None Available | |
| Dinunzio Andrew Joseph | $13,500 | Midland Title Security Inc | |
| Underkofler Richard L | -- | -- | |
| Estok Elaine | -- | -- | |
| Underkofler Ida Mae | -- | -- | |
| Coghill Barbara A | -- | -- |
Source: Public Records
Tax History Compared to Growth
Tax History
| Year | Tax Paid | Tax Assessment Tax Assessment Total Assessment is a certain percentage of the fair market value that is determined by local assessors to be the total taxable value of land and additions on the property. | Land | Improvement |
|---|---|---|---|---|
| 2024 | $3,057 | $43,540 | $8,435 | $35,105 |
| 2023 | $2,588 | $29,190 | $6,370 | $22,820 |
| 2022 | $2,530 | $29,190 | $6,370 | $22,820 |
| 2021 | $2,820 | $29,190 | $6,370 | $22,820 |
| 2020 | $2,677 | $25,170 | $5,500 | $19,670 |
| 2019 | $2,411 | $71,900 | $15,700 | $56,200 |
| 2018 | $2,434 | $25,170 | $5,500 | $19,670 |
| 2017 | $2,592 | $22,400 | $4,550 | $17,850 |
| 2016 | $2,598 | $22,400 | $4,550 | $17,850 |
| 2015 | $2,521 | $22,400 | $4,550 | $17,850 |
| 2014 | $2,521 | $22,400 | $4,550 | $17,850 |
Source: Public Records
Map
Nearby Homes
- 27101 Zeman Ave
- 27190 Shoreview Ave
- 712 E 266th St
- 26471 Farringdon Ave
- 780 E 266th St
- 26430 Drakefield Ave
- 559 Sycamore Dr
- 26471 Shoreview Ave
- 26351 Farringdon Ave
- 577 Sycamore Dr
- 635 E 261st St
- 461 E 271st St
- 640 E 261st St
- 26171 Shoreview Ave
- 546 Walnut Dr
- 440 E 271st St
- 26230 Oriole Ave
- 29038 Fuller Ave
- 415 E 266th St
- 405 E 262nd St
- 27131 Shirley Ave
- 27081 Shirley Ave
- 27151 Shirley Ave
- 27051 Shirley Ave
- 27100 Farringdon Ave
- 27080 Farringdon Ave
- 27130 Farringdon Ave
- 27171 Shirley Ave
- 27150 Farringdon Ave
- 27050 Farringdon Ave
- 27100 Shirley Ave
- 27080 Shirley Ave
- 27130 Shirley Ave
- 27030 Farringdon Ave
- 27170 Farringdon Ave
- 27050 Shirley Ave
- 27150 Shirley Ave
- 27191 Shirley Ave
- 27001 Shirley Ave
- 27030 Shirley Ave