
Landlord's Agent in 2025
Irene Lewin
LEWIN & CARR INC.
(757) 710-6712
36 in this area
185 Total Sales


Estimated Value: $519,000 - $603,000
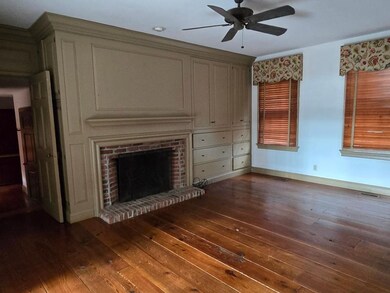
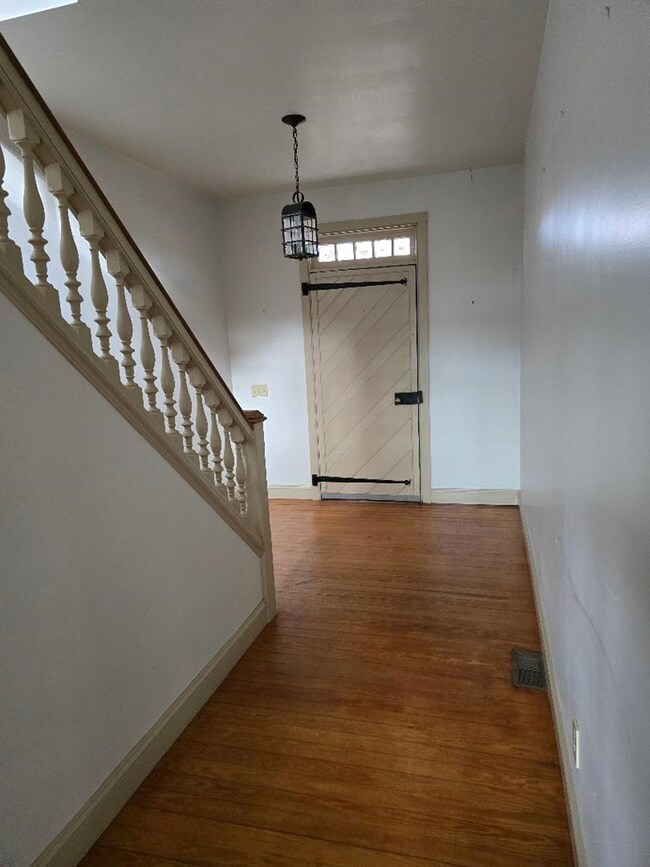
My dream kitchen at Bull Branch Dr., 2407 sq' waterfront home. There are two AGA ranges, a butler's room, and a huge pantry. While being built in 1976, one is hard-pressed to believe that the wide plank pine flooring, old wood-covered cabinets, fireplaces, cedar shake roof, and the Eastern Shore Big House Little House architectural style reflect homes built in the 1900s. The master ensuite, with its own winter porch, is on the first floor. Screen porch that spans the back elevation with lovely views of the creek. 2 bedrooms and a bath on the 2nd floor. Barn, dock, and saltwater pool too. Conventionally located near the town center of Onancock.
Last Agent to Rent the Property
LEWIN & CARR INC. Brokerage Email: 7577870901, lewininc@verizon.net License #0225055270 Listed on: 03/07/2025
Last Renter's Agent
LEWIN & CARR INC. Brokerage Email: 7577870901, lewininc@verizon.net License #0225055270 Listed on: 03/07/2025
| Date | Buyer | Sale Price | Title Company |
|---|---|---|---|
| Jack Floyd S | $775,000 | Attorney Only |
| Date | Status | Borrower | Loan Amount |
|---|---|---|---|
| Open | Jack Floyd S | $620,000 |
| Date | Event | Price | List to Sale | Price per Sq Ft | Prior Sale |
|---|---|---|---|---|---|
| 05/08/2025 05/08/25 | Rented | $3,500 | 0.0% | -- | |
| 05/07/2025 05/07/25 | Off Market | $3,500 | -- | -- | |
| 03/31/2025 03/31/25 | Price Changed | $3,500 | -12.5% | $1 / Sq Ft | |
| 03/07/2025 03/07/25 | For Rent | $4,000 | +60.0% | -- | |
| 04/25/2024 04/25/24 | Rented | $2,500 | 0.0% | -- | |
| 04/09/2024 04/09/24 | For Rent | $2,500 | +56.3% | -- | |
| 07/30/2019 07/30/19 | Under Contract | -- | -- | -- | |
| 06/26/2019 06/26/19 | For Rent | $1,600 | 0.0% | -- | |
| 06/26/2019 06/26/19 | Rented | $1,600 | 0.0% | -- | |
| 07/25/2018 07/25/18 | Sold | $775,000 | -3.0% | $274 / Sq Ft | View Prior Sale |
| 07/23/2018 07/23/18 | Pending | -- | -- | -- | |
| 03/08/2018 03/08/18 | For Sale | $799,000 | -- | $282 / Sq Ft |
| Year | Tax Paid | Tax Assessment Tax Assessment Total Assessment is a certain percentage of the fair market value that is determined by local assessors to be the total taxable value of land and additions on the property. | Land | Improvement |
|---|---|---|---|---|
| 2025 | $2,207 | $413,300 | $143,700 | $269,600 |
| 2024 | $2,000 | $413,300 | $143,700 | $269,600 |
| 2023 | $2,165 | $363,800 | $140,800 | $223,000 |
| 2022 | $2,165 | $363,800 | $140,800 | $223,000 |
| 2021 | $2,191 | $359,100 | $140,800 | $218,300 |
| 2020 | $2,191 | $359,100 | $140,800 | $218,300 |
| 2019 | $2,075 | $340,200 | $140,800 | $199,400 |
| 2018 | $2,075 | $340,200 | $140,800 | $199,400 |
| 2017 | $2,120 | $347,600 | $140,800 | $206,800 |
| 2016 | $2,120 | $347,600 | $140,800 | $206,800 |
| 2015 | $2,058 | $354,900 | $140,800 | $214,100 |
| 2014 | $2,058 | $354,900 | $140,800 | $214,100 |
| 2013 | -- | $365,300 | $140,800 | $224,500 |
Landlord's Agent in 2025
Irene Lewin
LEWIN & CARR INC.
(757) 710-6712
36 in this area
185 Total Sales
S
Seller's Agent in 2024
Susan Beasley
Weichert, Realtors Mason - Davis
(757) 710-1284
24 in this area
110 Total Sales
Seller's Agent in 2019
Leslie Parker
COLDWELL BANKER HARBOUR REALTY
(757) 894-0910
19 in this area
85 Total Sales
Source: Eastern Shore Association of REALTORS®
MLS Number: 63924
APN: 092-00-04-00-0001-00