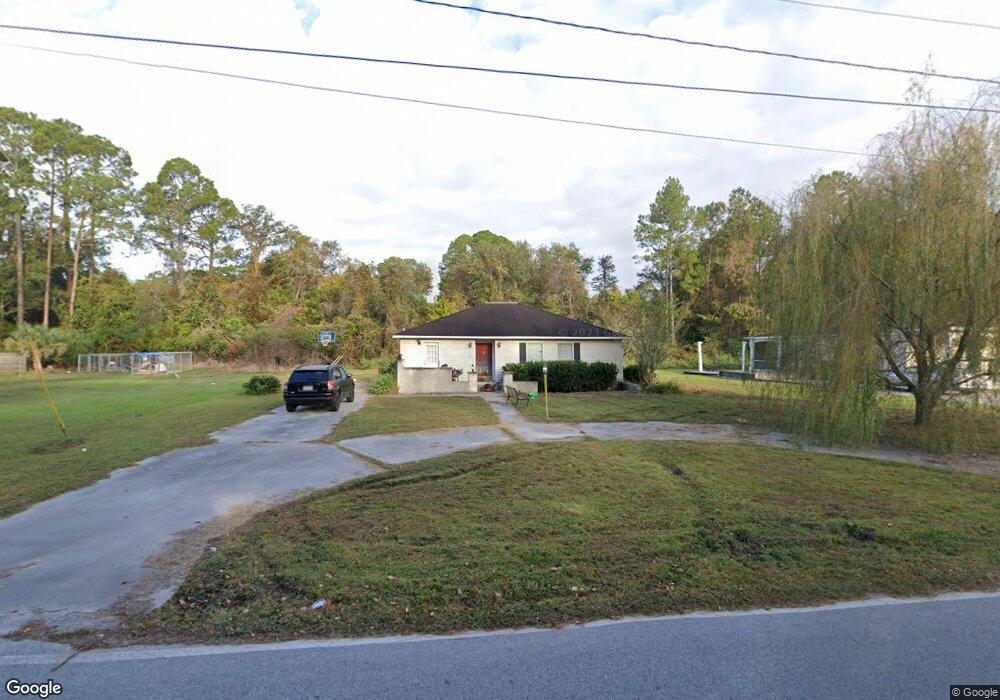
2711 Alice St Waycross, GA 31501
Estimated Value: $155,000 - $163,000
2
Beds
1
Bath
1,272
Sq Ft
$124/Sq Ft
Est. Value
About This Home
This home is located at 2711 Alice St, Waycross, GA 31501 and is currently estimated at $157,366, approximately $123 per square foot. 2711 Alice St is a home located in Ware County with nearby schools including Center Elementary School, Waycross Middle School, and Ware County High School.
Ownership History
Date
Name
Owned For
Owner Type
Purchase Details
Closed on
Nov 28, 2006
Sold by
Mattox N Chester
Bought by
Wandoff Karen M
Current Estimated Value
Home Financials for this Owner
Home Financials are based on the most recent Mortgage that was taken out on this home.
Original Mortgage
$67,497
Outstanding Balance
$40,310
Interest Rate
6.29%
Mortgage Type
FHA
Estimated Equity
$117,056
Purchase Details
Closed on
Jan 11, 2005
Sold by
Watts Leroy
Bought by
Mattox N Chester and Hughes Ann M
Home Financials for this Owner
Home Financials are based on the most recent Mortgage that was taken out on this home.
Original Mortgage
$57,920
Interest Rate
5.62%
Mortgage Type
New Conventional
Purchase Details
Closed on
Nov 21, 2001
Sold by
Flag Bank
Bought by
Watts Leroy
Purchase Details
Closed on
May 1, 2001
Sold by
Bryson J Allen
Bought by
Flag Bank
Purchase Details
Closed on
Oct 20, 1997
Sold by
Lott Land Corp
Bought by
Bryson J Allen
Purchase Details
Closed on
Jun 5, 1995
Sold by
Lott Dan
Bought by
Lott Land Corp
Create a Home Valuation Report for This Property
The Home Valuation Report is an in-depth analysis detailing your home's value as well as a comparison with similar homes in the area
Home Values in the Area
Average Home Value in this Area
Purchase History
| Date | Buyer | Sale Price | Title Company |
|---|---|---|---|
| Wandoff Karen M | $77,500 | -- | |
| Mattox N Chester | $72,400 | -- | |
| Watts Leroy | $55,000 | -- | |
| Flag Bank | -- | -- | |
| Bryson J Allen | -- | -- | |
| Lott Land Corp | -- | -- |
Source: Public Records
Mortgage History
| Date | Status | Borrower | Loan Amount |
|---|---|---|---|
| Open | Wandoff Karen M | $67,497 | |
| Previous Owner | Mattox N Chester | $57,920 |
Source: Public Records
Tax History Compared to Growth
Tax History
| Year | Tax Paid | Tax Assessment Tax Assessment Total Assessment is a certain percentage of the fair market value that is determined by local assessors to be the total taxable value of land and additions on the property. | Land | Improvement |
|---|---|---|---|---|
| 2024 | $439 | $53,824 | $4,680 | $49,144 |
| 2023 | $448 | $39,460 | $2,888 | $36,572 |
| 2022 | $499 | $39,460 | $2,888 | $36,572 |
| 2021 | $1,304 | $34,114 | $2,888 | $31,226 |
| 2020 | $1,203 | $30,210 | $2,888 | $27,322 |
| 2019 | $1,229 | $30,528 | $2,888 | $27,640 |
| 2018 | $1,204 | $29,272 | $2,888 | $26,384 |
| 2017 | $1,174 | $29,272 | $2,888 | $26,384 |
| 2016 | $1,174 | $29,272 | $2,888 | $26,384 |
| 2015 | $1,182 | $29,271 | $2,888 | $26,384 |
| 2014 | $1,181 | $29,272 | $2,888 | $26,384 |
| 2013 | -- | $29,271 | $2,888 | $26,383 |
Source: Public Records
Map
Nearby Homes
- 2706 Alice St
- 404 Community Dr
- 601 Community Dr
- 607 Linden Dr
- 2509 Tebeau St
- 2099 Ridge Rd
- 2108 Screven Ave
- 2202 Pioneer St
- 2123 Sunnyside Dr
- 2312 Spurgeon St
- 2120 Tebeau St
- 1206 Morningside Dr
- 1103 Kontz Ave
- 1715 City Blvd
- 1011 Cherokee Cir
- 00 Pineview Dr
- 0 Pineview Dr
- 1703 Rainbow Dr
- 1002 Cherokee Cir
- Lot 3 City Blvd
- 2713 Alice St
- 2414 Oleander Dr
- 2410 Oleander Dr
- 2705 Alice St
- 313 Lisbon Dr
- 2408 Oleander Dr
- 405 Community Dr
- 309 Lisbon Dr
- 2411 Oleander Dr
- 503 Community Dr
- 501 Community Dr
- 310 Pinehurst Dr
- 2409 Oleander Dr
- 2704 Alice St
- 401 Community Dr
- 00 Community Dr
- 0 Community Dr Unit 22574
- 0 Community Dr Unit 18917
- 0 Community Dr
- 505 Community Dr