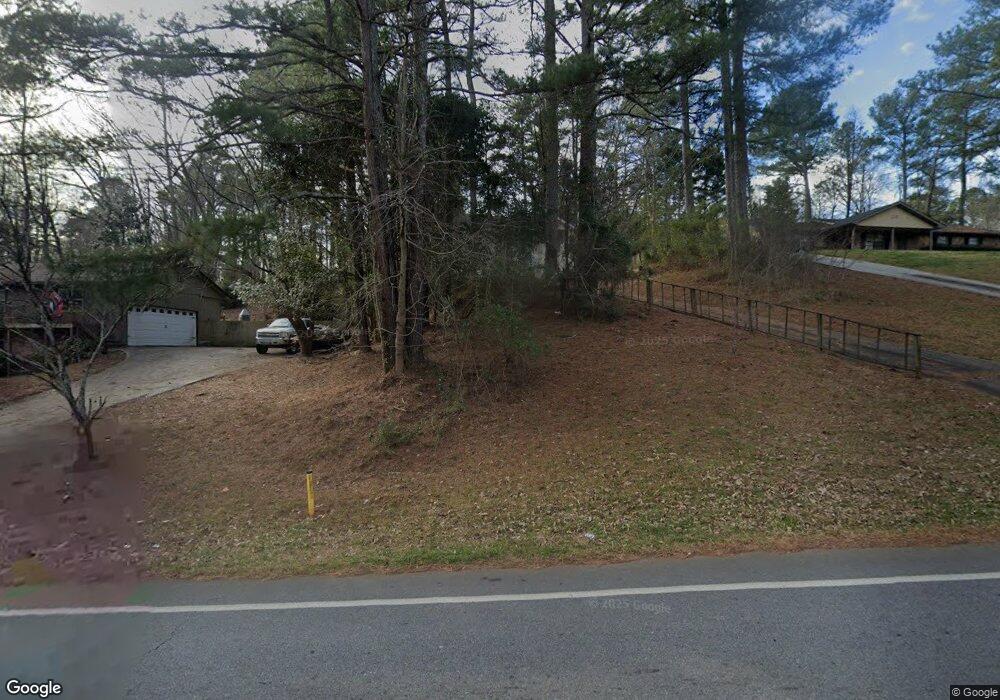
2711 Davenport Rd Duluth, GA 30096
Estimated Value: $351,000 - $394,000
3
Beds
2
Baths
1,248
Sq Ft
$296/Sq Ft
Est. Value
About This Home
This home is located at 2711 Davenport Rd, Duluth, GA 30096 and is currently estimated at $369,034, approximately $295 per square foot. 2711 Davenport Rd is a home located in Gwinnett County with nearby schools including B.B. Harris Elementary School, Duluth Middle School, and Duluth High School.
Ownership History
Date
Name
Owned For
Owner Type
Purchase Details
Closed on
Feb 7, 2024
Sold by
Zhang Yuying
Bought by
Zhang Lirong
Current Estimated Value
Purchase Details
Closed on
Nov 3, 2022
Sold by
Zhang Lirong
Bought by
Zhang Lirong
Purchase Details
Closed on
Apr 29, 2010
Sold by
Us Bank Na Tbw 2006-2
Bought by
Zhang Yuying and Zhang Changling
Purchase Details
Closed on
Feb 3, 2009
Sold by
Yamini Lawrence A
Bought by
Us Bank Na Tbw 2006-2
Purchase Details
Closed on
Mar 1, 2005
Sold by
Clover Larry E
Bought by
Yamini Ents Asset Mgmt Llc
Home Financials for this Owner
Home Financials are based on the most recent Mortgage that was taken out on this home.
Original Mortgage
$134,300
Interest Rate
5.6%
Purchase Details
Closed on
Apr 21, 1995
Sold by
Kenney Diane M
Bought by
Clover Larry E
Create a Home Valuation Report for This Property
The Home Valuation Report is an in-depth analysis detailing your home's value as well as a comparison with similar homes in the area
Home Values in the Area
Average Home Value in this Area
Purchase History
| Date | Buyer | Sale Price | Title Company |
|---|---|---|---|
| Zhang Lirong | -- | -- | |
| Zhang Lirong | $140,000 | -- | |
| Zhang Yuying | $54,000 | -- | |
| Us Bank Na Tbw 2006-2 | $130,068 | -- | |
| Yamini Ents Asset Mgmt Llc | $112,500 | -- | |
| Clover Larry E | $91,000 | -- |
Source: Public Records
Mortgage History
| Date | Status | Borrower | Loan Amount |
|---|---|---|---|
| Previous Owner | Yamini Ents Asset Mgmt Llc | $134,300 | |
| Closed | Clover Larry E | $0 |
Source: Public Records
Tax History Compared to Growth
Tax History
| Year | Tax Paid | Tax Assessment Tax Assessment Total Assessment is a certain percentage of the fair market value that is determined by local assessors to be the total taxable value of land and additions on the property. | Land | Improvement |
|---|---|---|---|---|
| 2025 | $5,831 | $156,560 | $27,880 | $128,680 |
| 2024 | $4,307 | $111,760 | $28,000 | $83,760 |
| 2023 | $4,307 | $111,760 | $28,000 | $83,760 |
| 2022 | $973 | $76,560 | $15,600 | $60,960 |
| 2021 | $973 | $76,560 | $15,600 | $60,960 |
| 2020 | $971 | $76,560 | $15,600 | $60,960 |
| 2019 | $848 | $55,120 | $15,600 | $39,520 |
| 2018 | $830 | $55,120 | $15,600 | $39,520 |
| 2016 | $870 | $55,120 | $15,600 | $39,520 |
| 2015 | $889 | $55,120 | $15,600 | $39,520 |
| 2014 | -- | $48,680 | $8,000 | $40,680 |
Source: Public Records
Map
Nearby Homes
- 2702 Davenport Rd
- 2644 Davenport Rd
- 3576 Randy Place
- 2829 Cardinal Trace
- 3412 Davenport Park Ln
- 2888 Cardinal Trace
- 3289 Davenport Park Ln
- 3518 Tracey Dr
- 3215 Oxwell Dr Unit 1B
- 3190 Oxwell Dr
- 2995 Oxwell Dr Unit 1
- 2961 Creek Dr
- 3053 Hartright Bend Ct
- 3315 Oak Hampton Way Unit 1
- 2976 Nelson Dr
- 2590 Village Place Dr
- 3576 Highland Pine Way
- 2638 Village Park Bend
- 3102 Claiborne Dr
- 3593 Gainesway Ct
- 2705 Davenport Rd
- 2715 Davenport Rd
- 3589 Citrus Dr
- 3585 Citrus Dr
- 3593 Citrus Dr
- 2721 Davenport Rd
- 2685 Davenport Rd
- 3597 Citrus Dr
- 3581 Citrus Dr
- 2725 Davenport Rd
- 2675 Davenport Rd
- 2712 Davenport Rd
- 0 Citrus Dr NW Unit 7085668
- 0 Citrus Dr NW Unit 8622429
- 0 Citrus Dr NW Unit 8541482
- 0 Citrus Dr NW Unit 8454349
- 0 Citrus Dr NW Unit 8027881
- 0 Citrus Dr NW Unit 7410599
- 0 Citrus Dr NW Unit 8442998
- 0 Citrus Dr NW Unit 8705706