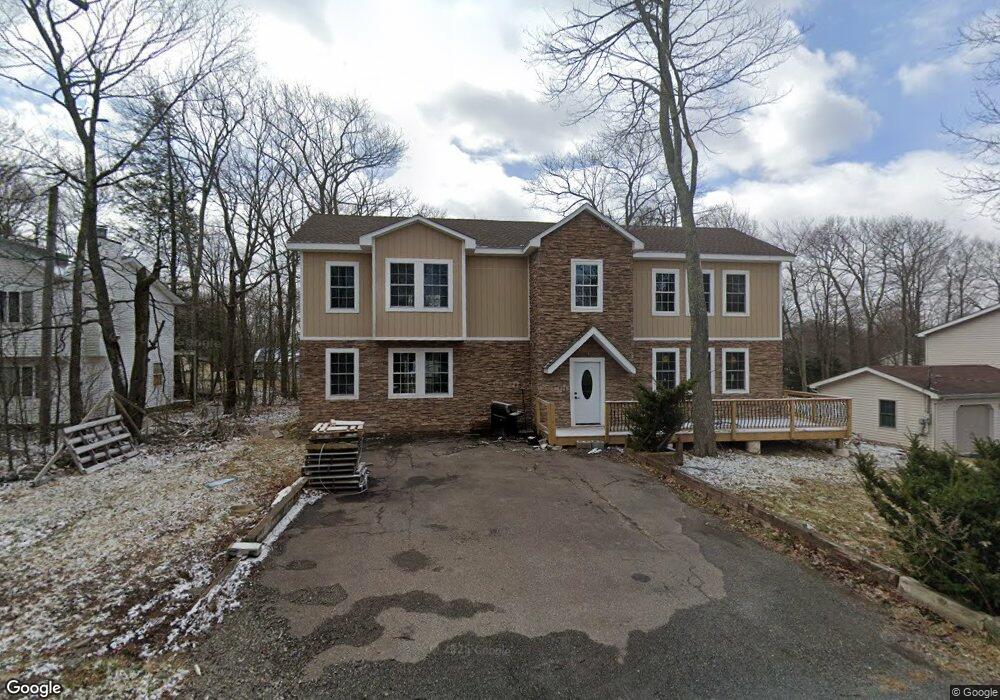
2711 Dorset Rd Tobyhanna, PA 18466
Estimated Value: $216,000 - $228,000
3
Beds
2
Baths
1,344
Sq Ft
$165/Sq Ft
Est. Value
About This Home
This home is located at 2711 Dorset Rd, Tobyhanna, PA 18466 and is currently estimated at $222,000, approximately $165 per square foot. 2711 Dorset Rd is a home located in Monroe County with nearby schools including Clear Run Intermediate School, Pocono Mountain West Junior High School, and Pocono Mountain West High School.
Ownership History
Date
Name
Owned For
Owner Type
Purchase Details
Closed on
Feb 11, 2025
Sold by
Fordham Holding Inc and Fordham Holding Llc
Bought by
Stela Homes Llc
Current Estimated Value
Home Financials for this Owner
Home Financials are based on the most recent Mortgage that was taken out on this home.
Original Mortgage
$318,750
Outstanding Balance
$316,834
Interest Rate
6.85%
Mortgage Type
Credit Line Revolving
Estimated Equity
-$94,834
Purchase Details
Closed on
Nov 9, 2017
Sold by
Kaja Holdings 2 Llc
Bought by
Milewski Dariusz
Purchase Details
Closed on
Apr 15, 2015
Sold by
Bank Of America National Association
Bought by
Kaja Holdings 2 Llc
Purchase Details
Closed on
Dec 1, 2014
Sold by
Micciche Bill J and Micciche Sharon F
Bought by
Bank Of America Na
Create a Home Valuation Report for This Property
The Home Valuation Report is an in-depth analysis detailing your home's value as well as a comparison with similar homes in the area
Home Values in the Area
Average Home Value in this Area
Purchase History
| Date | Buyer | Sale Price | Title Company |
|---|---|---|---|
| Stela Homes Llc | $225,000 | None Listed On Document | |
| Stela Homes Llc | $225,000 | None Listed On Document | |
| Milewski Dariusz | $25,000 | None Available | |
| Kaja Holdings 2 Llc | $18,000 | None Available | |
| Bank Of America Na | $2,124 | None Available |
Source: Public Records
Mortgage History
| Date | Status | Borrower | Loan Amount |
|---|---|---|---|
| Open | Stela Homes Llc | $318,750 | |
| Closed | Stela Homes Llc | $318,750 |
Source: Public Records
Tax History Compared to Growth
Tax History
| Year | Tax Paid | Tax Assessment Tax Assessment Total Assessment is a certain percentage of the fair market value that is determined by local assessors to be the total taxable value of land and additions on the property. | Land | Improvement |
|---|---|---|---|---|
| 2025 | $217 | $21,780 | $21,780 | $0 |
| 2024 | $182 | $21,780 | $21,780 | $0 |
| 2023 | $581 | $21,780 | $21,780 | $0 |
| 2022 | $571 | $21,780 | $21,780 | $0 |
| 2021 | $2,511 | $95,850 | $21,780 | $74,070 |
| 2020 | $673 | $95,850 | $21,780 | $74,070 |
| 2019 | $3,734 | $21,800 | $3,500 | $18,300 |
| 2018 | $3,734 | $21,800 | $3,500 | $18,300 |
| 2017 | $3,778 | $21,800 | $3,500 | $18,300 |
| 2016 | $807 | $21,800 | $3,500 | $18,300 |
| 2015 | $2,680 | $21,800 | $3,500 | $18,300 |
| 2014 | $2,680 | $21,800 | $3,500 | $18,300 |
Source: Public Records
Map
Nearby Homes
- 258 Dorset Rd
- 4186 Devon Dr
- 2127 Titania Rd
- 2150 Geraci Place
- 215 Dorset Rd
- 135 Fergus Way
- 141 Fergus Way
- 3123 #3621 Essex Rd
- 140 Fergus Way
- 1249 Cambell Way
- 3119 Essex Rd
- 4149 Romeo Rd
- 0 Robert David Dr Unit Lot 407
- 3210 Glouster Rd
- 6117 Rd
- 1581 Belgravia Dr
- 112 Ewe Ln
- 3109 Robert David Dr
- 8143 Mayfair Rd
- lot 4402 Bristol Ct
- 2710 Dorset Rd
- 2715 Dorset Rd
- 2706 Sussex Rd
- 2905 Dorset Rd
- 2713 Dorset Rd
- 2709 Dorset Rd Unit 6
- 2707 Sussex (A K A 207 Coach Rd) Rd
- 2705 Sussex Rd
- 215 Coach (Sussex) Rd
- 215 Coach Rd
- 207 Coach Rd
- 252 Dorset Rd
- 2908 Dorset Rd
- 250 Dorset Rd
- 256 Dorset Rd
- 2708 Sussex Rd
- 217 Coach Rd
- 248 Dorset Rd
- 4014 Rob Roy Dr
- 3517 Sussex Rd