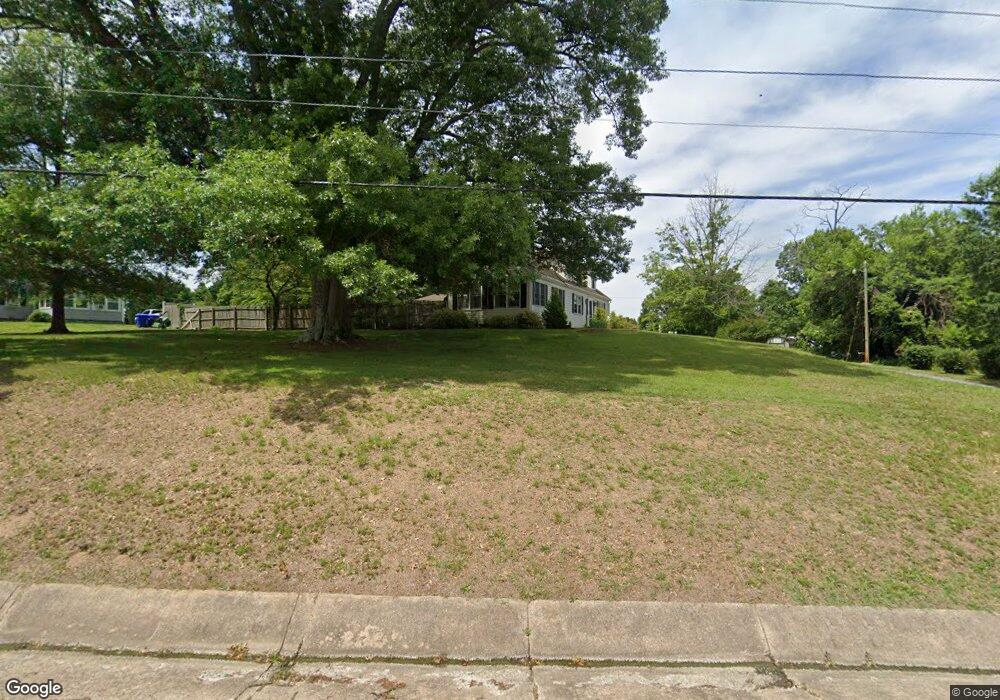
2711 Millington Rd Unit 1 Millington, MD 21651
Estimated Value: $341,000 - $564,402
1
Bed
1
Bath
2,376
Sq Ft
$190/Sq Ft
Est. Value
About This Home
This home is located at 2711 Millington Rd Unit 1, Millington, MD 21651 and is currently estimated at $450,851, approximately $189 per square foot. 2711 Millington Rd Unit 1 is a home located in Queen Anne's County with nearby schools including Sudlersville Elementary School, Sudlersville Middle School, and Queen Anne's County High School.
Ownership History
Date
Name
Owned For
Owner Type
Purchase Details
Closed on
Jan 22, 2025
Sold by
Vansant Ashley and Vansant Kaci
Bought by
Vansant Michael
Current Estimated Value
Purchase Details
Closed on
Nov 2, 2021
Sold by
Vansant Rebeka
Bought by
Vansant Ashley and Vansant Kaci
Purchase Details
Closed on
Mar 12, 2021
Sold by
Vansant Michael
Bought by
Vansant Rebeka
Purchase Details
Closed on
Jan 10, 2018
Sold by
Sigler Karen
Bought by
Vansant Mcihael
Purchase Details
Closed on
Mar 3, 2009
Sold by
Vansant Kenneth W
Bought by
Vansant Kenneth W Trustee
Purchase Details
Closed on
Jun 30, 2003
Sold by
Vansant Kenneth W Trustee Of The
Bought by
Vansant Kenneth W
Purchase Details
Closed on
May 30, 2000
Sold by
Vansant Kenneth W
Bought by
Vansant Kenneth W Trustee Of The
Create a Home Valuation Report for This Property
The Home Valuation Report is an in-depth analysis detailing your home's value as well as a comparison with similar homes in the area
Home Values in the Area
Average Home Value in this Area
Purchase History
| Date | Buyer | Sale Price | Title Company |
|---|---|---|---|
| Vansant Michael | -- | None Listed On Document | |
| Vansant Ashley | -- | None Available | |
| Vansant Rebeka | -- | None Available | |
| Vansant Mcihael | -- | None Available | |
| Vansant Kenneth W Trustee | -- | -- | |
| Vansant Kenneth W | -- | -- | |
| Vansant Kenneth W Trustee Of The | -- | -- |
Source: Public Records
Mortgage History
| Date | Status | Borrower | Loan Amount |
|---|---|---|---|
| Closed | Vansant Kenneth W | -- |
Source: Public Records
Tax History Compared to Growth
Tax History
| Year | Tax Paid | Tax Assessment Tax Assessment Total Assessment is a certain percentage of the fair market value that is determined by local assessors to be the total taxable value of land and additions on the property. | Land | Improvement |
|---|---|---|---|---|
| 2025 | $4,556 | $470,900 | $111,500 | $359,400 |
| 2024 | $4,331 | $447,067 | $0 | $0 |
| 2023 | $4,107 | $423,233 | $0 | $0 |
| 2022 | $3,882 | $399,400 | $88,100 | $311,300 |
| 2021 | $3,951 | $399,400 | $88,100 | $311,300 |
| 2020 | $3,951 | $399,400 | $88,100 | $311,300 |
| 2019 | $4,006 | $417,700 | $120,700 | $297,000 |
| 2018 | $3,820 | $398,333 | $0 | $0 |
| 2017 | $3,569 | $378,967 | $0 | $0 |
| 2016 | -- | $359,600 | $0 | $0 |
| 2015 | $1,738 | $359,600 | $0 | $0 |
| 2014 | $1,738 | $359,600 | $0 | $0 |
Source: Public Records
Map
Nearby Homes
- Parcel 104 Pfalzgroff Rd
- 32155 River Rd
- 356 Cypress St
- 218 Lakeside Dr
- 82 Kent Mill Dr
- 10669 Chesterville Forest Rd
- 0 Chesterville Forest Rd Unit PARCEL 84A
- 0 Chesterville Forest Rd Unit PARCEL 60
- 0 Carroll Clark Rd Unit MDKE2004182
- Lot 1 Carroll Clark Rd
- 0 Peters Corner Rd
- 10434 Big Stone Rd
- 0 Baxter Rd
- 209 3rd St
- 404 Spring Rd
- 114 W Main St
- 112 W Main St
- 12035 Galena Rd
- 550 Bolton Woods Rd
- 106 Charles St
- 2711 Millington Rd
- 100 Legion Rd
- 2614 Millington Rd
- 2704 Millington Rd
- 2612 Millington Rd
- 104 Legion Rd
- 2610 Millington Rd
- 101 Legion Rd
- 2606 Millington Rd
- 205 Groff Rd
- 2604 Millington Rd
- 105 Legion Rd
- 209 Groff Rd
- 2602 Millington Rd
- 108 Legion Rd
- 109 Legion Rd
- 2600 Millington Rd
- 110 Fishing Lake Ln
- 113 Legion Rd
- 213 Groff Rd