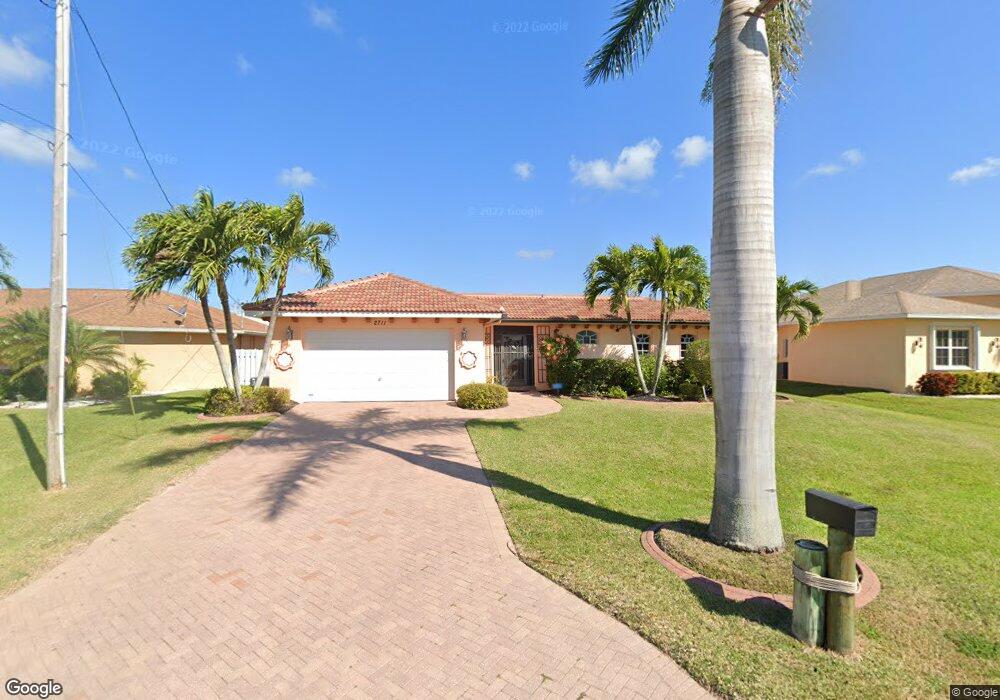
2711 SW 48th Terrace Cape Coral, FL 33914
Pelican NeighborhoodEstimated Value: $454,031 - $677,000
3
Beds
3
Baths
2,252
Sq Ft
$261/Sq Ft
Est. Value
About This Home
This home is located at 2711 SW 48th Terrace, Cape Coral, FL 33914 and is currently estimated at $587,008, approximately $260 per square foot. 2711 SW 48th Terrace is a home located in Lee County with nearby schools including Cape Elementary School, Caloosa Elementary School, and Tropic Isles Elementary School.
Ownership History
Date
Name
Owned For
Owner Type
Purchase Details
Closed on
May 4, 2015
Sold by
Carney Rita and Bevilacqua Dante J
Bought by
Bevilacqua Dante J and Revocab Carney Revocab
Current Estimated Value
Purchase Details
Closed on
Jan 28, 2010
Sold by
Deutsche Bank National Trust Company
Bought by
Carney Rita
Purchase Details
Closed on
Oct 2, 2009
Sold by
Dinolti Charlotee M
Bought by
Deutsche Bank National Trust Company
Purchase Details
Closed on
Sep 29, 2006
Sold by
2711 Investments Llc
Bought by
Dinolti Charlotte M
Home Financials for this Owner
Home Financials are based on the most recent Mortgage that was taken out on this home.
Original Mortgage
$391,500
Interest Rate
1.62%
Mortgage Type
Negative Amortization
Purchase Details
Closed on
May 14, 2004
Sold by
Clayman Raymond
Bought by
2711 Investments Llc
Purchase Details
Closed on
Jan 16, 2004
Sold by
Anderson John E and Bialon Klaus
Bought by
Clayman Raymond
Create a Home Valuation Report for This Property
The Home Valuation Report is an in-depth analysis detailing your home's value as well as a comparison with similar homes in the area
Home Values in the Area
Average Home Value in this Area
Purchase History
| Date | Buyer | Sale Price | Title Company |
|---|---|---|---|
| Bevilacqua Dante J | -- | Attorney | |
| Carney Rita | $212,000 | Consumer Title & Escrow Serv | |
| Deutsche Bank National Trust Company | -- | None Available | |
| Dinolti Charlotte M | $435,000 | Invest Sw Title Services | |
| 2711 Investments Llc | -- | -- | |
| Clayman Raymond | $46,500 | -- |
Source: Public Records
Mortgage History
| Date | Status | Borrower | Loan Amount |
|---|---|---|---|
| Previous Owner | Dinolti Charlotte M | $391,500 |
Source: Public Records
Tax History Compared to Growth
Tax History
| Year | Tax Paid | Tax Assessment Tax Assessment Total Assessment is a certain percentage of the fair market value that is determined by local assessors to be the total taxable value of land and additions on the property. | Land | Improvement |
|---|---|---|---|---|
| 2025 | $4,058 | $243,982 | -- | -- |
| 2024 | $3,901 | $237,106 | -- | -- |
| 2023 | $3,901 | $230,200 | $0 | $0 |
| 2022 | $3,633 | $223,495 | $0 | $0 |
| 2021 | $3,834 | $320,752 | $52,000 | $268,752 |
| 2020 | $4,118 | $213,989 | $0 | $0 |
| 2019 | $4,147 | $209,178 | $0 | $0 |
| 2018 | $4,158 | $205,278 | $0 | $0 |
| 2017 | $4,156 | $201,056 | $0 | $0 |
| 2016 | $4,108 | $273,545 | $45,000 | $228,545 |
| 2015 | $4,206 | $266,287 | $40,300 | $225,987 |
| 2014 | $4,130 | $233,897 | $32,000 | $201,897 |
| 2013 | -- | $218,401 | $19,500 | $198,901 |
Source: Public Records
Map
Nearby Homes
- 2809 Cape Coral Pkwy W
- 2622 SW 46th Terrace
- 2610 SW 46th Terrace
- 2812 SW 46th Terrace
- 4918 SW 27th Ave
- 2615 SW 46th Terrace
- 3000 Sunset Pointe Cir
- 4714 SW 25th Ct
- 2521 Cape Coral Pkwy W
- 4821 SW 29th Ave
- 4608 SW 25th Ct
- 2853 SW 47th Terrace
- 4709 SW 25th Place
- 4833 SW 25th Place
- 5003 SW 26th Ave
- 4836 SW 29th Ave
- 2417 Cape Coral Pkwy W
- 2419 Cape Coral Pkwy W
- 2832 SW 45th St
- 4809 SW 24th Place
- 2715 SW 48th Terrace
- 2707 SW 48th Terrace
- 2710 Cape Coral Pkwy W
- 2703 SW 48th Terrace
- 2719 SW 48th Terrace
- 2706 Cape Coral Pkwy W
- 2712 SW 48th Terrace
- 2718 Cape Coral Pkwy W
- 2720 Cape Coral Pkwy W
- 2708 SW 48th Terrace
- 2712 Cape Coral Pkwy W
- 2631 SW 48th Terrace
- 2723 SW 48th Terrace
- 2704 SW 48th Terrace
- 2702 Cape Coral Pkwy W Unit 72
- 2727 Cape Coral Pkwy W
- 2723 Cape Coral Pkwy W
- 2724 Cape Coral Pkwy W
- 2722 SW 48th Terrace
- 2719 Cape Coral Pkwy W