Estimated Value: $590,000 - $634,379
3
Beds
3
Baths
1,925
Sq Ft
$320/Sq Ft
Est. Value
About This Home
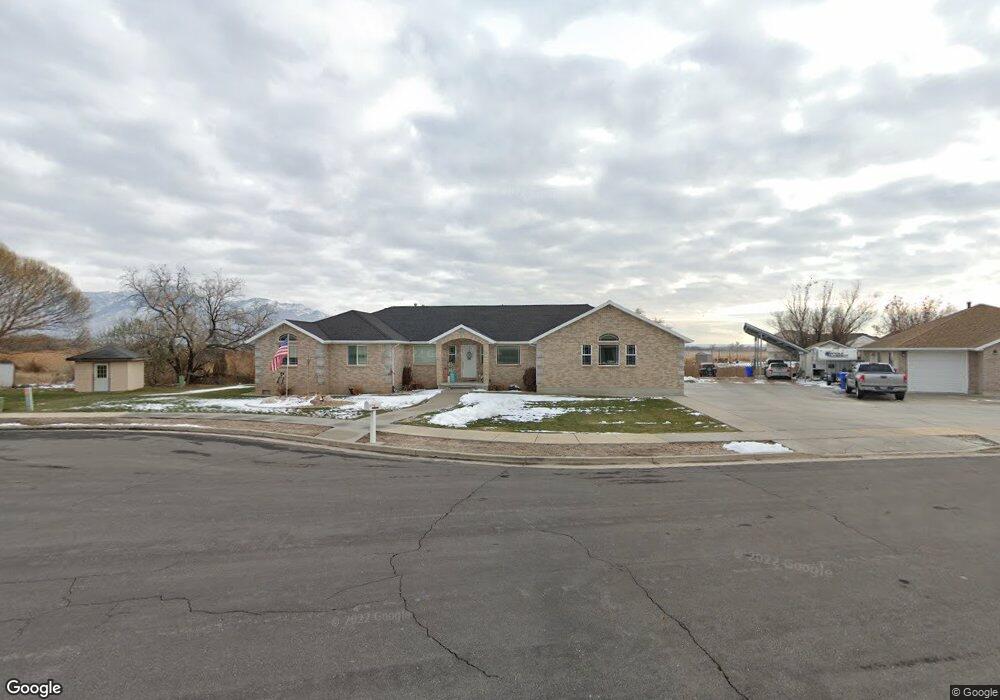
This home is located at 2711 W 1750 N Unit 19, Ogden, UT 84404 and is currently estimated at $615,345, approximately $319 per square foot. 2711 W 1750 N Unit 19 is a home located in Weber County with nearby schools including Plain City School, Wahlquist Junior High School, and Fremont High School.
Ownership History
Date
Name
Owned For
Owner Type
Purchase Details
Closed on
May 16, 2011
Sold by
Yearsley Kent G
Bought by
Yearsley Kent G
Current Estimated Value
Purchase Details
Closed on
Jan 14, 1998
Sold by
Cobbleglen Park Inc
Bought by
Yearsley Kent G
Create a Home Valuation Report for This Property
The Home Valuation Report is an in-depth analysis detailing your home's value as well as a comparison with similar homes in the area
Home Values in the Area
Average Home Value in this Area
Purchase History
| Date | Buyer | Sale Price | Title Company |
|---|---|---|---|
| Yearsley Kent G | -- | None Available | |
| Yearsley Kent G | -- | U S Title |
Source: Public Records
Tax History Compared to Growth
Tax History
| Year | Tax Paid | Tax Assessment Tax Assessment Total Assessment is a certain percentage of the fair market value that is determined by local assessors to be the total taxable value of land and additions on the property. | Land | Improvement |
|---|---|---|---|---|
| 2025 | $3,531 | $592,491 | $162,185 | $430,306 |
| 2024 | $3,337 | $320,099 | $89,203 | $230,896 |
| 2023 | $3,106 | $297,000 | $88,919 | $208,081 |
| 2022 | $2,886 | $281,600 | $88,919 | $192,681 |
| 2021 | $2,579 | $422,000 | $81,130 | $340,870 |
| 2020 | $2,310 | $343,000 | $65,779 | $277,221 |
| 2019 | $2,301 | $323,000 | $60,852 | $262,148 |
| 2018 | $2,312 | $311,000 | $60,852 | $250,148 |
| 2017 | $2,149 | $272,000 | $60,981 | $211,019 |
| 2016 | $2,157 | $149,720 | $33,435 | $116,285 |
| 2015 | $2,139 | $145,062 | $30,643 | $114,419 |
| 2014 | $1,870 | $130,138 | $30,643 | $99,495 |
Source: Public Records
Map
Nearby Homes
- 2081 W 1575 N Unit 127
- 2801 W 1900 N
- 4195 W 1575 N Unit 204
- 4183 W 1575 N Unit 205
- 1557 N 2750 W
- 2068 N 2850 W
- 2950 W 1975 N
- 2673 W 2125 N
- 2124 Heritage Dr
- 3047 N 2875 W Unit 7
- 2172 N 2625 W
- 2176 N 2900 W
- 2307 N 2850 W
- 2443 W 2950 N Unit 99
- 2443 W 2950 N
- 1838 N 2000 W
- 2705 2825 W Unit 67
- 3777 W Pioneer Rd
- 2495 N 2850 W
- 2540 W 2575 N
- 2711 W 1750 N
- 2723 W 1750 N
- 2723 W 1750 N Unit 20
- 2703 W 1750 N
- 2703 W 1750 N Unit 18
- 2702 W 1650 N
- 2735 W 1750 N
- 2735 W 1750 N Unit 21
- 2714 W 1750 N
- 2706 W 1750 N
- 2714 W 1650 N
- 2740 W 1750 N
- 1744 N 2750 W
- 2653 W 1800 N
- 1772 N 2750 W
- 1772 N 2750 W Unit 9
- 2637 W 1800 N
- 2637 W 1800 N Unit 2
- 2711 W 1800 N
- 2623 W 1800 N