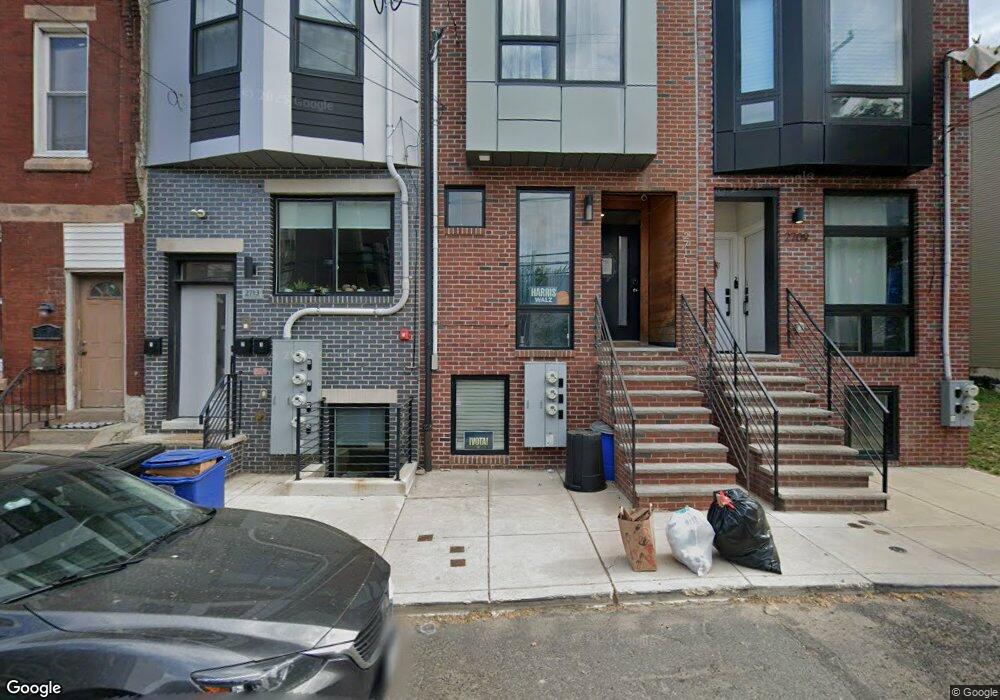
2711 W Jefferson St Unit 1 Philadelphia, PA 19121
Brewerytown NeighborhoodEstimated Value: $250,000 - $312,000
2
Beds
2
Baths
1,198
Sq Ft
$240/Sq Ft
Est. Value
About This Home
This home is located at 2711 W Jefferson St Unit 1, Philadelphia, PA 19121 and is currently estimated at $287,770, approximately $240 per square foot. 2711 W Jefferson St Unit 1 is a home located in Philadelphia County with nearby schools including William D. Kelley School, Langston Hughes Middle School, and Strawberry Mansion High School.
Ownership History
Date
Name
Owned For
Owner Type
Purchase Details
Closed on
Mar 22, 2024
Sold by
Clark Brian
Bought by
Kim Min-Sun
Current Estimated Value
Home Financials for this Owner
Home Financials are based on the most recent Mortgage that was taken out on this home.
Original Mortgage
$269,660
Outstanding Balance
$265,036
Interest Rate
6.77%
Mortgage Type
New Conventional
Estimated Equity
$22,734
Purchase Details
Closed on
Apr 19, 2019
Sold by
Simury Llc
Bought by
Clark Brian
Home Financials for this Owner
Home Financials are based on the most recent Mortgage that was taken out on this home.
Original Mortgage
$183,600
Interest Rate
4%
Mortgage Type
New Conventional
Purchase Details
Closed on
Dec 7, 2016
Sold by
Mckellar Keavin and Mckellar Kevin
Bought by
Simury Llc
Purchase Details
Closed on
May 9, 1993
Bought by
Mckellar Kevin
Create a Home Valuation Report for This Property
The Home Valuation Report is an in-depth analysis detailing your home's value as well as a comparison with similar homes in the area
Home Values in the Area
Average Home Value in this Area
Purchase History
| Date | Buyer | Sale Price | Title Company |
|---|---|---|---|
| Kim Min-Sun | $278,000 | Community First Abstract | |
| Clark Brian | $229,500 | None Available | |
| Simury Llc | $45,000 | None Available | |
| Mckellar Kevin | -- | -- |
Source: Public Records
Mortgage History
| Date | Status | Borrower | Loan Amount |
|---|---|---|---|
| Open | Kim Min-Sun | $269,660 | |
| Previous Owner | Clark Brian | $183,600 |
Source: Public Records
Tax History Compared to Growth
Tax History
| Year | Tax Paid | Tax Assessment Tax Assessment Total Assessment is a certain percentage of the fair market value that is determined by local assessors to be the total taxable value of land and additions on the property. | Land | Improvement |
|---|---|---|---|---|
| 2026 | $493 | $265,900 | $39,900 | $226,000 |
| 2025 | $493 | $265,900 | $39,900 | $226,000 |
| 2024 | $493 | $265,900 | $39,900 | $226,000 |
| 2023 | $493 | $234,500 | $35,200 | $199,300 |
| 2022 | $469 | $35,200 | $35,200 | $0 |
| 2021 | $469 | $0 | $0 | $0 |
| 2020 | $469 | $0 | $0 | $0 |
| 2019 | $1,398 | $0 | $0 | $0 |
| 2018 | $1,398 | $0 | $0 | $0 |
| 2017 | $190 | $0 | $0 | $0 |
| 2016 | $77 | $0 | $0 | $0 |
| 2015 | $74 | $0 | $0 | $0 |
| 2014 | -- | $5,500 | $5,500 | $0 |
| 2012 | -- | $2,560 | $2,560 | $0 |
Source: Public Records
Map
Nearby Homes
- 2711 W Jefferson St Unit 2
- 1517 N Marston St
- 2718 W Jefferson St
- 1450 N Etting St
- 1539 N Marston St
- 1449 N Etting St
- 1432 N Etting St
- 1447 N 28th St
- 1437 N 28th St
- 1527 N Newkirk St
- 1410 N 27th St
- 1504 N 26th St
- 1440 N Newkirk St
- 1723 N Dover St
- 1611 N 27th St
- 2726 W Master St
- 1421 N Dover St
- 1501 N 29th St
- 1424 N Dover St
- 1334 N 27th St
- 2711 W Jefferson St Unit 1
- 2711 W Jefferson St
- 2709 W Jefferson St
- 2709 W Jefferson St Unit 1
- 2709 W Jefferson St Unit 2
- 2713 W Jefferson St
- 2713 W Jefferson St Unit 3
- 2713 W Jefferson St Unit 2
- 2715 W Jefferson St
- 2707 W Jefferson St
- 2705 W Jefferson St
- 2717 W Jefferson St
- 2719 W Jefferson St
- 2703 W Jefferson St
- 1508 N 27th St
- 1508 N 27th St Unit 2
- 1508 N 27th St Unit 1
- 1510 N 27th St
- 1512 N 27th St
- 2701 W Jefferson St