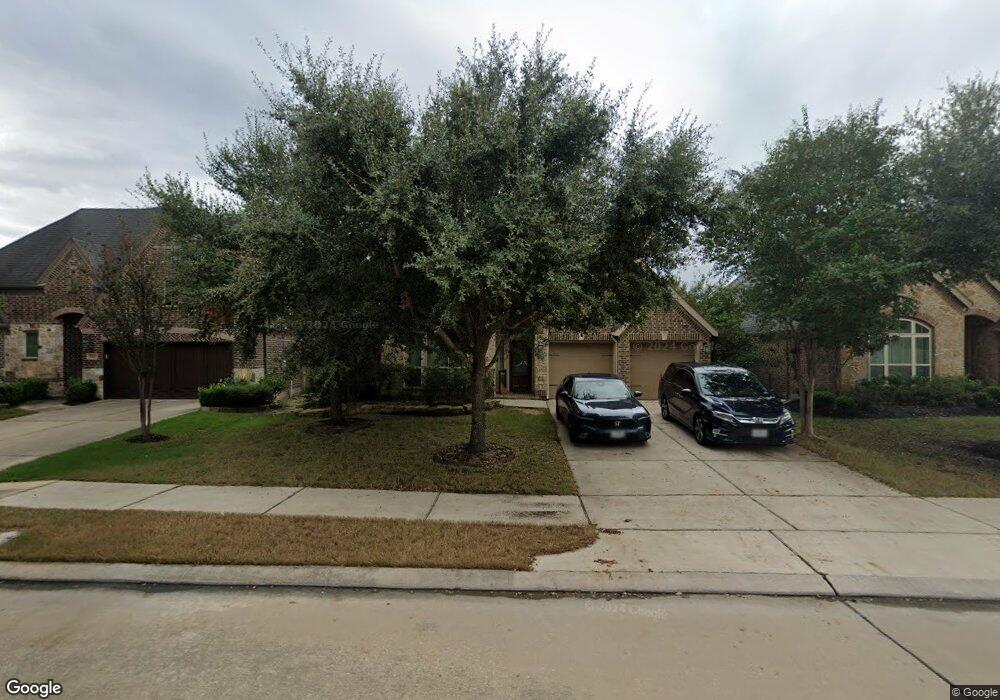
27119 Cross Pointe Ct Fulshear, TX 77441
Cross Creek Ranch NeighborhoodEstimated Value: $540,000 - $559,000
4
Beds
3
Baths
3,060
Sq Ft
$179/Sq Ft
Est. Value
About This Home
This home is located at 27119 Cross Pointe Ct, Fulshear, TX 77441 and is currently estimated at $548,798, approximately $179 per square foot. 27119 Cross Pointe Ct is a home located in Fort Bend County with nearby schools including James E. Randolph Elementary School, Joe M. Adams Junior High, and Sugar Creek Montessori - Fulshear/West Katy.
Ownership History
Date
Name
Owned For
Owner Type
Purchase Details
Closed on
Sep 6, 2016
Sold by
Gobar Lauren Mary and Gillem James
Bought by
Blassingame Henry
Current Estimated Value
Home Financials for this Owner
Home Financials are based on the most recent Mortgage that was taken out on this home.
Original Mortgage
$252,000
Outstanding Balance
$201,417
Interest Rate
3.45%
Mortgage Type
New Conventional
Estimated Equity
$347,381
Purchase Details
Closed on
Oct 30, 2013
Sold by
Perry Homes Llc
Bought by
Gobar Lauren Mary
Home Financials for this Owner
Home Financials are based on the most recent Mortgage that was taken out on this home.
Original Mortgage
$250,026
Interest Rate
4.56%
Mortgage Type
VA
Purchase Details
Closed on
May 28, 2013
Sold by
Ccr Loan Subsidiary 1 Lp
Bought by
Blassingame Henry
Create a Home Valuation Report for This Property
The Home Valuation Report is an in-depth analysis detailing your home's value as well as a comparison with similar homes in the area
Home Values in the Area
Average Home Value in this Area
Purchase History
| Date | Buyer | Sale Price | Title Company |
|---|---|---|---|
| Blassingame Henry | -- | None Available | |
| Gobar Lauren Mary | -- | Chicago Title | |
| Blassingame Henry | -- | -- | |
| Blassingame Henry | -- | -- |
Source: Public Records
Mortgage History
| Date | Status | Borrower | Loan Amount |
|---|---|---|---|
| Open | Blassingame Henry | $252,000 | |
| Previous Owner | Blassingame Henry | $250,026 |
Source: Public Records
Tax History Compared to Growth
Tax History
| Year | Tax Paid | Tax Assessment Tax Assessment Total Assessment is a certain percentage of the fair market value that is determined by local assessors to be the total taxable value of land and additions on the property. | Land | Improvement |
|---|---|---|---|---|
| 2025 | $9,081 | $552,033 | $73,485 | $478,548 |
| 2024 | $9,081 | $504,589 | $69,986 | $434,603 |
| 2023 | $13,457 | $503,473 | $53,835 | $449,638 |
| 2022 | $13,164 | $441,970 | $53,840 | $388,130 |
| 2021 | $10,638 | $339,050 | $53,840 | $285,210 |
| 2020 | $10,763 | $332,300 | $50,930 | $281,370 |
| 2019 | $11,492 | $337,700 | $53,470 | $284,230 |
| 2018 | $11,524 | $336,040 | $53,470 | $282,570 |
| 2017 | $11,911 | $343,990 | $53,470 | $290,520 |
| 2016 | $12,562 | $362,810 | $53,470 | $309,340 |
| 2015 | $6,835 | $349,070 | $53,470 | $295,600 |
| 2014 | $7,266 | $317,340 | $53,470 | $263,870 |
Source: Public Records
Map
Nearby Homes
- 27127 Birch Pine Ct
- 27231 Symphony Creek Ln
- 26819 Wescott Pines Dr
- 27318 Symphony Creek Ln
- 27330 Aspen Falls Ln
- 4930 Scenic Horizon Ln
- 28723 Primrose Bluff Dr
- 26827 Longleaf Valley Dr
- 26914 Harmony Shores Dr
- 28639 Rolling Ridge Dr
- 4915 Medina Bend Ln
- 27602 Balcones Heights Blvd
- 5431 Caspian Falls Ln
- 5122 Bartlett Vista Ct
- 4943 Ginger Bluff Trail
- 28707 Hemlock Red Ct
- 6027 Opal Crest Ln
- 6030 Mystic Berry Dr
- 10122 Stafford Hill Cove
- 27602 Lakeway Trail Ln
- 27115 Cross Pointe Ct
- 27123 Cross Pointe Ct
- 27127 Cross Pointe Ct
- 27111 Cross Pointe Ct
- 27107 Cross Pointe Ct
- 27131 Cross Pointe Ct
- 27122 Cross Pointe Ct
- 27118 Cross Pointe Ct
- 27126 Cross Pointe Ct
- 27103 Cross Pointe Ct
- 27114 Cross Pointe Ct
- 27130 Cross Pointe Ct
- 27110 Cross Pointe Ct
- 27102 Cross Pointe Ct
- 27106 Cross Pointe Ct
- 27123 Birch Pine Ct
- 27119 Birch Pine Ct
- 27131 Birch Pine Ct
- 27115 Birch Pine Ct
- 27115 Symphony Creek Ln