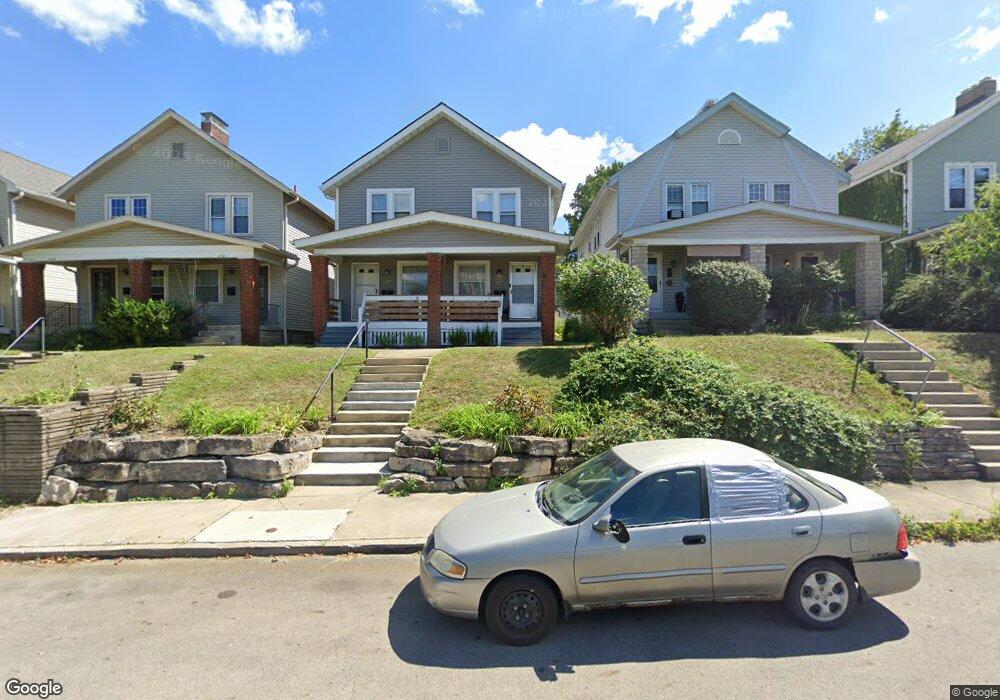
2712 Calumet St Unit 714 Columbus, OH 43202
Old North Columbus NeighborhoodEstimated Value: $310,716 - $456,000
6
Beds
2
Baths
2,080
Sq Ft
$191/Sq Ft
Est. Value
About This Home
This home is located at 2712 Calumet St Unit 714, Columbus, OH 43202 and is currently estimated at $396,429, approximately $190 per square foot. 2712 Calumet St Unit 714 is a home located in Franklin County with nearby schools including Clinton Elementary School, Dominion Middle School, and Whetstone High School.
Ownership History
Date
Name
Owned For
Owner Type
Purchase Details
Closed on
Sep 2, 2022
Sold by
Wall Frank and Wall Tomasina
Bought by
Wall Frank and Wall Tomasina
Current Estimated Value
Home Financials for this Owner
Home Financials are based on the most recent Mortgage that was taken out on this home.
Original Mortgage
$335,749
Outstanding Balance
$320,691
Interest Rate
5.22%
Mortgage Type
Credit Line Revolving
Estimated Equity
$75,738
Purchase Details
Closed on
Aug 31, 2022
Sold by
2712 Calumet Ltd
Bought by
Wall Frank and Wall Tomasina
Home Financials for this Owner
Home Financials are based on the most recent Mortgage that was taken out on this home.
Original Mortgage
$335,749
Outstanding Balance
$320,691
Interest Rate
5.22%
Mortgage Type
Credit Line Revolving
Estimated Equity
$75,738
Purchase Details
Closed on
Jul 5, 2019
Sold by
Harris Robert M and Harris Patricia A
Bought by
2712 Calumet Ltd
Purchase Details
Closed on
Mar 5, 1991
Bought by
Harris Robert M
Purchase Details
Closed on
Jan 28, 1988
Create a Home Valuation Report for This Property
The Home Valuation Report is an in-depth analysis detailing your home's value as well as a comparison with similar homes in the area
Home Values in the Area
Average Home Value in this Area
Purchase History
| Date | Buyer | Sale Price | Title Company |
|---|---|---|---|
| Wall Frank | -- | Crown Search Box | |
| Wall Frank | $355,000 | Crown Search Box | |
| 2712 Calumet Ltd | -- | None Available | |
| Harris Robert M | $80,000 | -- | |
| -- | $30,000 | -- |
Source: Public Records
Mortgage History
| Date | Status | Borrower | Loan Amount |
|---|---|---|---|
| Open | Wall Frank | $335,749 |
Source: Public Records
Tax History Compared to Growth
Tax History
| Year | Tax Paid | Tax Assessment Tax Assessment Total Assessment is a certain percentage of the fair market value that is determined by local assessors to be the total taxable value of land and additions on the property. | Land | Improvement |
|---|---|---|---|---|
| 2024 | $5,172 | $114,040 | $35,460 | $78,580 |
| 2023 | $5,107 | $114,040 | $35,460 | $78,580 |
| 2022 | $4,424 | $83,240 | $25,590 | $57,650 |
| 2021 | $4,432 | $83,240 | $25,590 | $57,650 |
| 2020 | $4,438 | $83,240 | $25,590 | $57,650 |
| 2019 | $3,981 | $64,020 | $19,670 | $44,350 |
| 2018 | $3,572 | $64,020 | $19,670 | $44,350 |
| 2017 | $3,731 | $64,020 | $19,670 | $44,350 |
| 2016 | $3,481 | $51,240 | $12,040 | $39,200 |
| 2015 | $3,169 | $51,240 | $12,040 | $39,200 |
| 2014 | $3,177 | $51,240 | $12,040 | $39,200 |
| 2013 | $1,493 | $48,825 | $11,480 | $37,345 |
Source: Public Records
Map
Nearby Homes
- 109-117 E Arcadia Ave
- 2680 Deming Ave
- 374 Parkview Dr Unit D
- 116-118 E Hudson St
- 2584 Deming Ave
- 2537 Medary Ave Unit 539
- 69-71 E Duncan St
- 270 E Kelso Rd
- 415 Glen Echo Cir
- 185 E Tompkins St
- 2804 Indianola Ave
- 363 E Hudson St Unit 365
- 203 E Tulane Rd
- 2836-2838 Indianola Ave Unit 2836
- 360-364 E Tompkins St
- 304 E Tulane Rd
- 2828 Kensington Place W
- 2521 Glenmawr Ave
- 2683 Neil Ave Unit 685
- 180 Tibet Rd
- 2706 Calumet St Unit 708
- 2716 Calumet St Unit 718
- 2684 Calumet St
- 2702 Calumet St Unit 704
- 2682 Calumet St
- 2720 Calumet St Unit 722
- 2680 Calumet St
- 2678 Calumet St
- 2674 Calumet St
- 2672 Calumet St
- 2670 Calumet St
- 2668 Calumet St
- 2666 Calumet St
- 2664 Calumet St
- 2662 Calumet St
- 2660 Calumet St
- 223 Cliffside Dr
- 2700 Calumet St
- 2656 Calumet St
- 2654 Calumet St