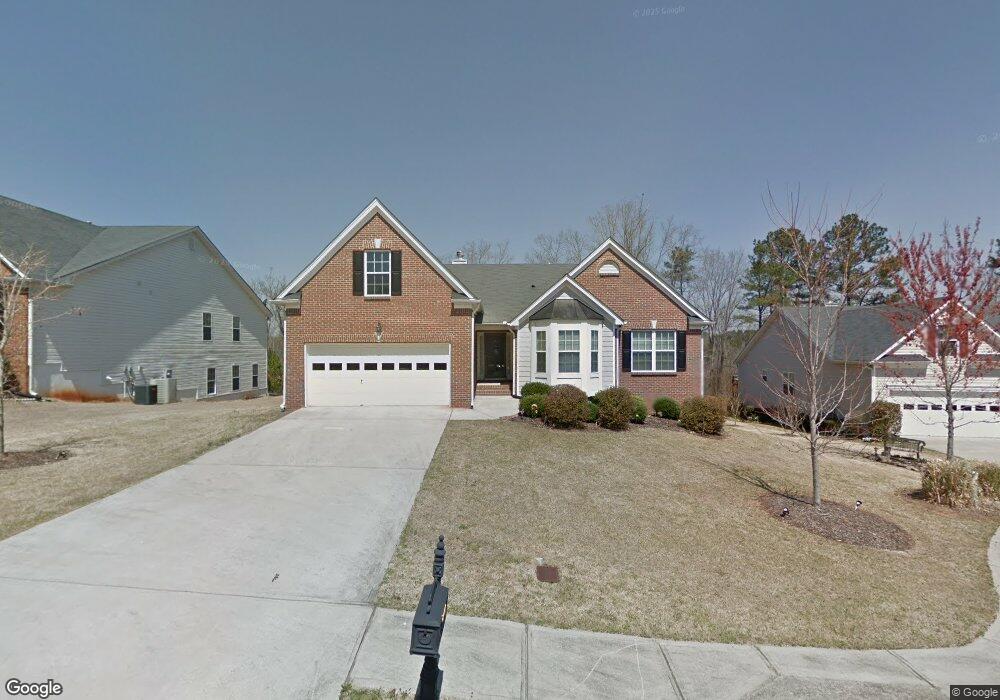
2712 Carleton Gold Rd Unit 6B Dacula, GA 30019
Estimated Value: $420,992 - $486,000
3
Beds
2
Baths
2,546
Sq Ft
$172/Sq Ft
Est. Value
About This Home
This home is located at 2712 Carleton Gold Rd Unit 6B, Dacula, GA 30019 and is currently estimated at $438,998, approximately $172 per square foot. 2712 Carleton Gold Rd Unit 6B is a home located in Gwinnett County with nearby schools including Dacula Elementary School, Dacula Middle School, and Dacula High School.
Ownership History
Date
Name
Owned For
Owner Type
Purchase Details
Closed on
Aug 31, 2011
Sold by
Deutsche Bank National Tru
Bought by
Brown Reginald P
Current Estimated Value
Home Financials for this Owner
Home Financials are based on the most recent Mortgage that was taken out on this home.
Original Mortgage
$108,000
Outstanding Balance
$73,914
Interest Rate
4.4%
Mortgage Type
New Conventional
Estimated Equity
$365,084
Purchase Details
Closed on
Mar 1, 2011
Sold by
Coleman Billy R and Coleman Vanessa B
Bought by
Deutsche Bank Series 2007-3
Purchase Details
Closed on
Feb 16, 2007
Sold by
Arlington Builders Llc
Bought by
Coleman Billy R and Coleman Vanessa B
Home Financials for this Owner
Home Financials are based on the most recent Mortgage that was taken out on this home.
Original Mortgage
$247,688
Interest Rate
7%
Mortgage Type
New Conventional
Create a Home Valuation Report for This Property
The Home Valuation Report is an in-depth analysis detailing your home's value as well as a comparison with similar homes in the area
Home Values in the Area
Average Home Value in this Area
Purchase History
| Date | Buyer | Sale Price | Title Company |
|---|---|---|---|
| Brown Reginald P | $135,000 | -- | |
| Deutsche Bank Series 2007-3 | $134,000 | -- | |
| Coleman Billy R | $260,800 | -- |
Source: Public Records
Mortgage History
| Date | Status | Borrower | Loan Amount |
|---|---|---|---|
| Open | Brown Reginald P | $108,000 | |
| Previous Owner | Coleman Billy R | $247,688 |
Source: Public Records
Tax History Compared to Growth
Tax History
| Year | Tax Paid | Tax Assessment Tax Assessment Total Assessment is a certain percentage of the fair market value that is determined by local assessors to be the total taxable value of land and additions on the property. | Land | Improvement |
|---|---|---|---|---|
| 2025 | $1,217 | $210,760 | $30,000 | $180,760 |
| 2024 | $1,216 | $187,000 | $32,000 | $155,000 |
| 2023 | $1,216 | $176,120 | $26,000 | $150,120 |
| 2022 | $1,177 | $176,120 | $26,000 | $150,120 |
| 2021 | $1,163 | $129,680 | $20,800 | $108,880 |
| 2020 | $1,161 | $119,080 | $20,800 | $98,280 |
| 2019 | $1,075 | $114,240 | $19,200 | $95,040 |
| 2018 | $1,047 | $97,720 | $16,800 | $80,920 |
| 2016 | $1,086 | $85,320 | $14,000 | $71,320 |
| 2015 | $2,797 | $79,320 | $12,000 | $67,320 |
| 2014 | -- | $76,120 | $12,000 | $64,120 |
Source: Public Records
Map
Nearby Homes
- 2652 Carleton Gold Rd
- 2623 Carleton Gold Rd
- 67 Creek Side Place
- 2579 Wimberley Pine Ct
- 510 Roland Manor Dr
- 2793 Austin Ridge Dr
- 2535 Fairmont Park Ct
- 2864 Auburn Ave
- 2827 Riders Ct
- 2896 Spence Ct
- 2800 Araglin Dr
- 2693 Austin Ridge Dr
- 2768 Ballyshannon Ct
- 3422 Fishpond Cir
- 535 Maeve Ln
- 3507 Fishpond Cir
- 3527 Fishpond Cir
- 3347 Fishpond Cir
- 3557 Fishpond (Lot 95) Cir
- 2702 Carleton Gold Rd Unit 6B
- 2722 Carleton Gold Rd
- 2692 Carleton Gold Rd
- 2732 Carleton Gold Rd Unit 81
- 2732 Carleton Gold Rd
- 2713 Carleton Gold Rd
- 2713 Carleton Gold Rd
- 2713 Carleton Gold Rd Unit 6
- 2723 Carleton Gold Rd
- 2693 Carleton Gold Rd
- 2733 Carleton Gold Rd Unit 6B
- 2682 Carleton Gold Rd Unit 6B
- 615 Ballyshannon Dr NE
- 359 Endeavor Way
- 359 Endeavor Way Ln
- 2672 Carleton Gold Rd
- 2672 Carleton Gold Rd Unit 87
- 605 Ballyshannon Dr
- 349 Endeavor Way
- 620 Ballyshannon Dr