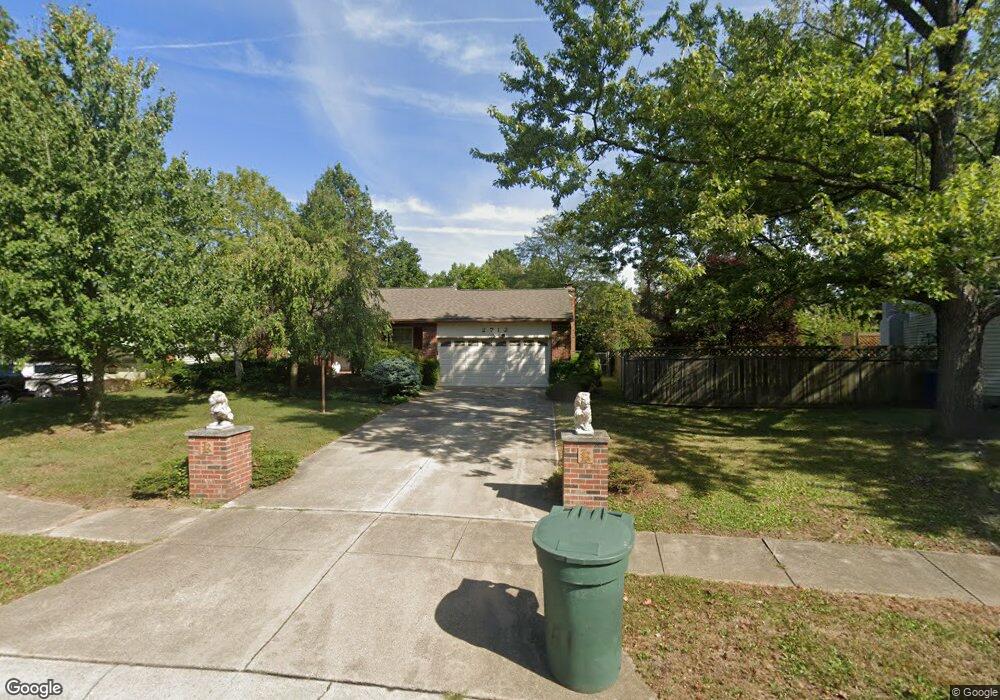
2712 Central Park Place Columbus, OH 43231
Northern Woods NeighborhoodEstimated Value: $286,696 - $378,000
3
Beds
2
Baths
1,336
Sq Ft
$236/Sq Ft
Est. Value
About This Home
This home is located at 2712 Central Park Place, Columbus, OH 43231 and is currently estimated at $315,674, approximately $236 per square foot. 2712 Central Park Place is a home located in Franklin County with nearby schools including Pointview Elementary School, Genoa Middle School, and Westerville South High School.
Ownership History
Date
Name
Owned For
Owner Type
Purchase Details
Closed on
Jun 16, 1999
Sold by
Stokesbury Rocky J
Bought by
Kimball William H and Kimball Chong C
Current Estimated Value
Home Financials for this Owner
Home Financials are based on the most recent Mortgage that was taken out on this home.
Original Mortgage
$59,750
Outstanding Balance
$15,771
Interest Rate
7.06%
Estimated Equity
$299,903
Purchase Details
Closed on
Dec 13, 1995
Sold by
Myres Glen
Bought by
Becky J Stokesbury
Home Financials for this Owner
Home Financials are based on the most recent Mortgage that was taken out on this home.
Original Mortgage
$100,225
Outstanding Balance
$2,066
Interest Rate
7.45%
Mortgage Type
New Conventional
Estimated Equity
$313,608
Purchase Details
Closed on
Sep 1, 1984
Purchase Details
Closed on
Jul 1, 1983
Create a Home Valuation Report for This Property
The Home Valuation Report is an in-depth analysis detailing your home's value as well as a comparison with similar homes in the area
Home Values in the Area
Average Home Value in this Area
Purchase History
| Date | Buyer | Sale Price | Title Company |
|---|---|---|---|
| Kimball William H | $119,500 | Title First Agency Inc | |
| Becky J Stokesbury | $105,500 | -- | |
| -- | $69,800 | -- | |
| -- | $65,900 | -- |
Source: Public Records
Mortgage History
| Date | Status | Borrower | Loan Amount |
|---|---|---|---|
| Open | Kimball William H | $59,750 | |
| Open | Becky J Stokesbury | $100,225 |
Source: Public Records
Tax History Compared to Growth
Tax History
| Year | Tax Paid | Tax Assessment Tax Assessment Total Assessment is a certain percentage of the fair market value that is determined by local assessors to be the total taxable value of land and additions on the property. | Land | Improvement |
|---|---|---|---|---|
| 2024 | $3,872 | $75,850 | $19,950 | $55,900 |
| 2023 | $3,931 | $75,845 | $19,950 | $55,895 |
| 2022 | $3,915 | $59,960 | $15,330 | $44,630 |
| 2021 | $3,953 | $59,960 | $15,330 | $44,630 |
| 2020 | $3,940 | $59,960 | $15,330 | $44,630 |
| 2019 | $3,310 | $47,950 | $12,250 | $35,700 |
| 2018 | $3,266 | $47,950 | $12,250 | $35,700 |
| 2017 | $3,267 | $47,950 | $12,250 | $35,700 |
| 2016 | $3,286 | $44,250 | $11,030 | $33,220 |
| 2015 | $3,294 | $44,250 | $11,030 | $33,220 |
| 2014 | $3,296 | $44,250 | $11,030 | $33,220 |
| 2013 | $1,729 | $46,585 | $11,620 | $34,965 |
Source: Public Records
Map
Nearby Homes
- 2721 Woodland Trail Dr Unit 2721
- 2727 Patrick Ave
- 2623 Blendon Woods Blvd
- 2677-2679 Blossom Ave
- 2981 Blendon Woods Blvd Unit 983
- 2800 Overview Ct Unit 2800B
- 2292 Laurelwood Dr Unit 2292L
- 3066 Ravine Pointe Dr Unit 3066
- 3001 Cooper Bluff Dr Unit 3001
- 3038 Highcliff Ct
- 6048 Pinemoor St
- 3070 Highcliff Ct Unit 3070
- 3068 Highcliff Ct Unit 3068
- 2197 Bayfield Dr
- 5841 Forest Hills Blvd Unit 5843
- 5678 Great Hall Ct Unit 12C
- 2120 Willowick Dr Unit B
- 5681 Oliver St
- 6658 Walbridge St
- 2250 Webster Canyon Ct
- 2704 Central Park Place
- 2722 Central Park Place
- 6193 Central Park Dr
- 2696 Central Park Place
- 2641 Oakstone Dr
- 2715 Central Park Place
- 2707 Central Park Place
- 2689 Central Park Place
- 2695 Central Park Place
- 2600 Tiller Ln Unit c
- 2600 Tiller Ln Unit B
- 2600 Tiller Ln Unit A
- 2600 Tiller Ln
- 2586 Oakstone Dr
- 6138 Central Park Dr
- 2600 Oakstone Dr Unit 22
- 2600 Oakstone Dr Unit 19
- 2600 Oakstone Dr Unit 9
- 2600 Oakstone Dr Unit 8
- 2584 Oakstone Dr