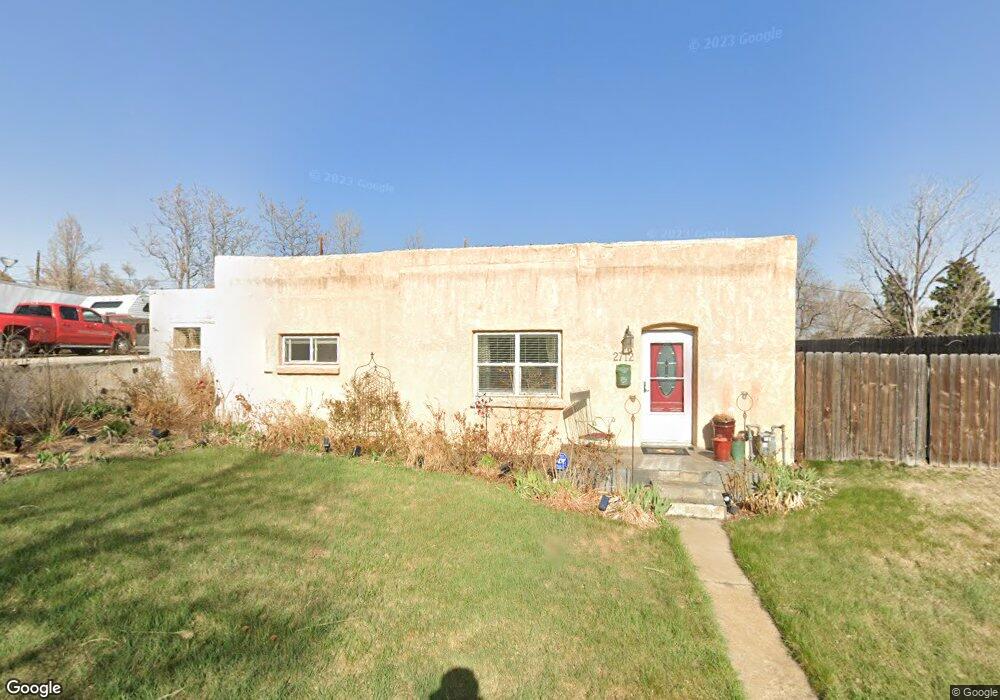
2712 Depew St Wheat Ridge, CO 80214
East Wheat Ridge NeighborhoodEstimated Value: $536,000 - $750,000
2
Beds
1
Bath
1,428
Sq Ft
$456/Sq Ft
Est. Value
About This Home
This home is located at 2712 Depew St, Wheat Ridge, CO 80214 and is currently estimated at $651,582, approximately $456 per square foot. 2712 Depew St is a home located in Jefferson County with nearby schools including Rocky Mountain Prep - Berkeley, Midtown Montessori Academy @ Sloan's Lake, and Beth Eden Baptist School.
Ownership History
Date
Name
Owned For
Owner Type
Purchase Details
Closed on
Jan 29, 1999
Sold by
Pallaoro Michael Dean
Bought by
Callahan Gearold H
Current Estimated Value
Home Financials for this Owner
Home Financials are based on the most recent Mortgage that was taken out on this home.
Original Mortgage
$119,816
Outstanding Balance
$28,481
Interest Rate
6.79%
Mortgage Type
FHA
Estimated Equity
$623,101
Purchase Details
Closed on
Jan 7, 1999
Sold by
Henkel Mary A
Bought by
Pallaoro Michael Dean
Home Financials for this Owner
Home Financials are based on the most recent Mortgage that was taken out on this home.
Original Mortgage
$119,816
Outstanding Balance
$28,481
Interest Rate
6.79%
Mortgage Type
FHA
Estimated Equity
$623,101
Purchase Details
Closed on
Dec 29, 1995
Sold by
Mcclelland Jon F and Mcclelland Donna I
Bought by
Henkel Mary A
Home Financials for this Owner
Home Financials are based on the most recent Mortgage that was taken out on this home.
Original Mortgage
$147,950
Interest Rate
6.75%
Create a Home Valuation Report for This Property
The Home Valuation Report is an in-depth analysis detailing your home's value as well as a comparison with similar homes in the area
Home Values in the Area
Average Home Value in this Area
Purchase History
| Date | Buyer | Sale Price | Title Company |
|---|---|---|---|
| Callahan Gearold H | $120,000 | -- | |
| Pallaoro Michael Dean | $111,825 | -- | |
| Henkel Mary A | $155,750 | North American Title |
Source: Public Records
Mortgage History
| Date | Status | Borrower | Loan Amount |
|---|---|---|---|
| Open | Callahan Gearold H | $119,816 | |
| Previous Owner | Henkel Mary A | $147,950 |
Source: Public Records
Tax History Compared to Growth
Tax History
| Year | Tax Paid | Tax Assessment Tax Assessment Total Assessment is a certain percentage of the fair market value that is determined by local assessors to be the total taxable value of land and additions on the property. | Land | Improvement |
|---|---|---|---|---|
| 2024 | $2,843 | $39,215 | $21,982 | $17,233 |
| 2023 | $2,843 | $39,215 | $21,982 | $17,233 |
| 2022 | $2,358 | $33,438 | $17,625 | $15,813 |
| 2021 | $2,391 | $34,401 | $18,133 | $16,268 |
| 2020 | $2,369 | $34,290 | $19,784 | $14,506 |
| 2019 | $2,338 | $34,290 | $19,784 | $14,506 |
| 2018 | $1,949 | $29,078 | $10,045 | $19,033 |
| 2017 | $1,760 | $29,078 | $10,045 | $19,033 |
| 2016 | $2,154 | $25,045 | $6,092 | $18,953 |
| 2015 | $1,819 | $25,045 | $6,092 | $18,953 |
| 2014 | $1,819 | $19,844 | $5,158 | $14,686 |
Source: Public Records
Map
Nearby Homes
- 2577 Depew St
- 2568 Eaton St
- 2590 Gray St
- 2834 Benton St
- 2598 Harlan St Unit 1
- 5128 W 26th Ave Unit 208
- 5128 W 26th Ave Unit 205
- 5128 W 26th Ave Unit 101
- 5128 W 26th Ave Unit 311
- 5128 W 26th Ave Unit 312
- 5128 W 26th Ave Unit 104
- 5128 W 26th Ave Unit 207
- 2890 N Harlan St Unit 102
- 2403 Chase St Unit 25
- 2403 Chase St
- 2933 Benton St
- 6000 W 29th Ave
- 3019 Chase St
- 2355 Ames St
- 5125 W 29th Ave Unit 1