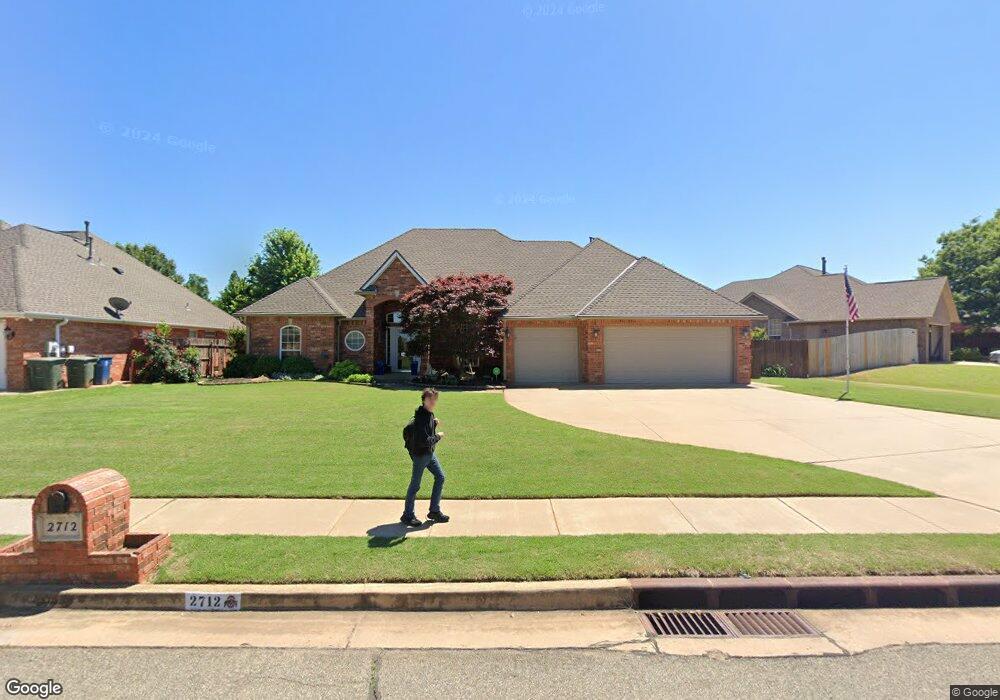
2712 Durland Dr Edmond, OK 73012
Homestead NeighborhoodEstimated Value: $352,320 - $388,000
4
Beds
3
Baths
2,336
Sq Ft
$160/Sq Ft
Est. Value
About This Home
This home is located at 2712 Durland Dr, Edmond, OK 73012 and is currently estimated at $373,080, approximately $159 per square foot. 2712 Durland Dr is a home located in Oklahoma County with nearby schools including Frontier Elementary, Cheyenne Middle School, and North High School.
Ownership History
Date
Name
Owned For
Owner Type
Purchase Details
Closed on
Mar 30, 2021
Sold by
Lee Peter H and Lee Countes
Bought by
Lee Peter Henry and Lee Countess Lajeanne
Current Estimated Value
Purchase Details
Closed on
Oct 8, 1999
Sold by
Lisk Harry and Lisk Dorothy W
Bought by
Lee Peter H and Lee Countess
Home Financials for this Owner
Home Financials are based on the most recent Mortgage that was taken out on this home.
Original Mortgage
$166,860
Outstanding Balance
$50,497
Interest Rate
7.86%
Estimated Equity
$322,583
Purchase Details
Closed on
Jul 30, 1998
Sold by
Goldstar Homes L L C
Bought by
Lisk Harry and Lisk Dorothy W
Purchase Details
Closed on
Mar 3, 1998
Sold by
Danforth Development L L C
Bought by
Goldstar Homes L L C
Home Financials for this Owner
Home Financials are based on the most recent Mortgage that was taken out on this home.
Original Mortgage
$140,800
Interest Rate
9%
Create a Home Valuation Report for This Property
The Home Valuation Report is an in-depth analysis detailing your home's value as well as a comparison with similar homes in the area
Home Values in the Area
Average Home Value in this Area
Purchase History
| Date | Buyer | Sale Price | Title Company |
|---|---|---|---|
| Lee Peter Henry | -- | None Available | |
| Lee Peter H | $180,000 | -- | |
| Lisk Harry | $178,500 | First American Title & Tr Co | |
| Goldstar Homes L L C | $25,000 | -- |
Source: Public Records
Mortgage History
| Date | Status | Borrower | Loan Amount |
|---|---|---|---|
| Open | Lee Peter H | $166,860 | |
| Previous Owner | Goldstar Homes L L C | $140,800 |
Source: Public Records
Tax History Compared to Growth
Tax History
| Year | Tax Paid | Tax Assessment Tax Assessment Total Assessment is a certain percentage of the fair market value that is determined by local assessors to be the total taxable value of land and additions on the property. | Land | Improvement |
|---|---|---|---|---|
| 2024 | $3,016 | $30,830 | $3,957 | $26,873 |
| 2023 | $3,016 | $29,932 | $4,004 | $25,928 |
| 2022 | $2,936 | $29,061 | $4,489 | $24,572 |
| 2021 | $2,834 | $28,215 | $4,884 | $23,331 |
| 2020 | $2,793 | $27,500 | $5,548 | $21,952 |
| 2019 | $2,748 | $26,950 | $5,548 | $21,402 |
| 2018 | $2,718 | $26,510 | $0 | $0 |
| 2017 | $2,740 | $26,839 | $5,548 | $21,291 |
| 2016 | $2,703 | $26,536 | $4,332 | $22,204 |
| 2015 | $2,618 | $25,763 | $4,275 | $21,488 |
| 2014 | $2,535 | $25,013 | $4,344 | $20,669 |
Source: Public Records
Map
Nearby Homes
- 1812 Natchez Rd
- 2904 Canton Ln
- 2424 Semillon Way
- 604 NW 197th St
- 2324 Merlot Ct
- 1233 Bradford Place
- 1212 Pine Valley
- 19917 Rambling Creek Dr
- 2713 Jills Trail
- 2605 Jills Trail
- 804 NW 193rd St
- 19504 Fieldshire Dr
- 821 NW 192nd Terrace
- 900 Woodhollow Trail
- 2204 Pine View Terrace
- 19608 Harness Ct
- 621 NW 188th St
- 2020 Pine View Terrace
- 928 NW 191st St
- 2708 Tanager Dr
- 2708 Durland Dr
- 2704 Durland Dr
- 2828 Canton Ln
- 2829 Overland Way
- 1805 Lancaster Cir
- 2825 Overland Way
- 2709 Durland Dr
- 2817 Overland Way
- 2705 Durland Dr
- 1813 Lancaster Dr
- 2833 Overland Way
- 2832 Canton Ln
- 1809 Lancaster Cir
- 1801 Lancaster Cir
- 2809 Overland Way
- 2708 Lancaster Ct
- 2701 Durland Dr
- 2836 Canton Ln
- 2704 Lancaster Ct
- 2824 Overland Way