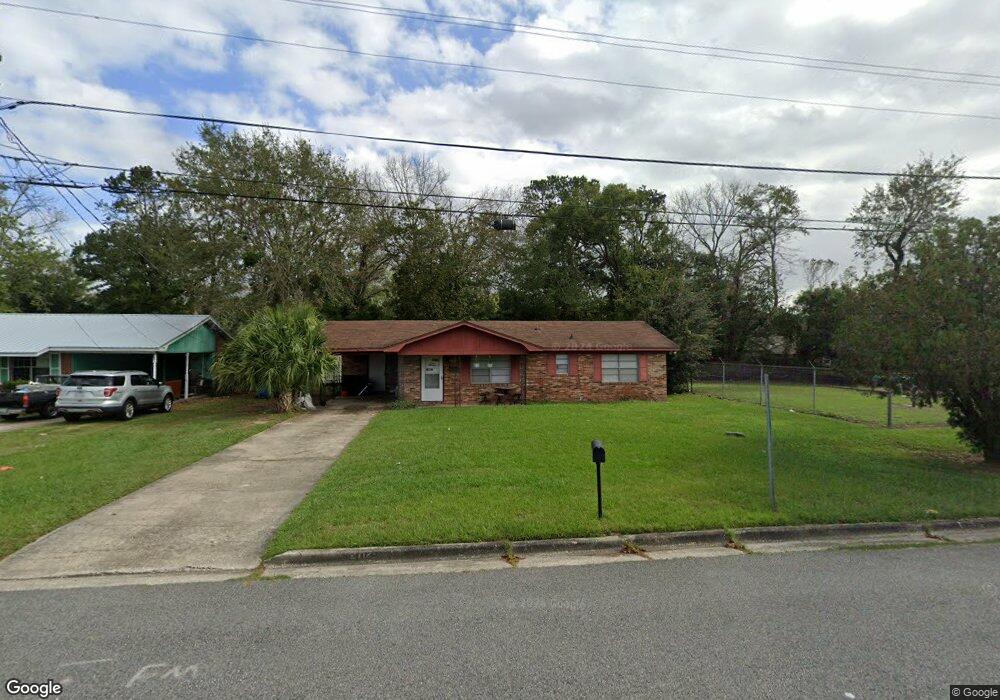
2712 Gordon St Brunswick, GA 31520
Estimated Value: $95,000 - $137,000
2
Beds
1
Bath
1,025
Sq Ft
$111/Sq Ft
Est. Value
About This Home
This home is located at 2712 Gordon St, Brunswick, GA 31520 and is currently estimated at $113,751, approximately $110 per square foot. 2712 Gordon St is a home located in Glynn County with nearby schools including Burroughs-Molette Elementary School, Risley Middle School, and Brunswick High School.
Ownership History
Date
Name
Owned For
Owner Type
Purchase Details
Closed on
Feb 8, 2023
Sold by
Rountree Terence A
Bought by
Lynch Laquata
Current Estimated Value
Home Financials for this Owner
Home Financials are based on the most recent Mortgage that was taken out on this home.
Original Mortgage
$78,551
Outstanding Balance
$76,213
Interest Rate
6.62%
Mortgage Type
FHA
Estimated Equity
$37,538
Purchase Details
Closed on
Mar 28, 2006
Sold by
Rountree Clifford T
Bought by
Rountree Clifford T and Rountree Robert L
Create a Home Valuation Report for This Property
The Home Valuation Report is an in-depth analysis detailing your home's value as well as a comparison with similar homes in the area
Home Values in the Area
Average Home Value in this Area
Purchase History
| Date | Buyer | Sale Price | Title Company |
|---|---|---|---|
| Lynch Laquata | $80,000 | -- | |
| Rountree Clifford T | -- | -- |
Source: Public Records
Mortgage History
| Date | Status | Borrower | Loan Amount |
|---|---|---|---|
| Open | Lynch Laquata | $78,551 |
Source: Public Records
Tax History Compared to Growth
Tax History
| Year | Tax Paid | Tax Assessment Tax Assessment Total Assessment is a certain percentage of the fair market value that is determined by local assessors to be the total taxable value of land and additions on the property. | Land | Improvement |
|---|---|---|---|---|
| 2025 | $856 | $40,720 | $3,680 | $37,040 |
| 2024 | $673 | $32,000 | $3,680 | $28,320 |
| 2023 | $1,435 | $31,600 | $3,680 | $27,920 |
| 2022 | $1,075 | $20,880 | $3,680 | $17,200 |
| 2021 | $892 | $16,320 | $3,680 | $12,640 |
| 2020 | $898 | $16,320 | $3,680 | $12,640 |
| 2019 | $362 | $16,320 | $3,680 | $12,640 |
| 2018 | $392 | $16,320 | $3,680 | $12,640 |
| 2017 | $865 | $16,320 | $3,680 | $12,640 |
| 2016 | $807 | $17,400 | $3,680 | $13,720 |
| 2015 | $830 | $17,400 | $3,680 | $13,720 |
| 2014 | $830 | $17,400 | $3,680 | $13,720 |
Source: Public Records
Map
Nearby Homes
- 2626 Gordon St
- 2005 R St
- 2611 Albany St
- 2918 Wolfe St
- 2308 Albany St
- 2314 Wolfe St
- 608 Q St
- 602 Q St
- 3215 Wesley Ave
- 3314 N Cleburne St
- 3107 Prim Place
- 3310 Franklin Ave
- 3404 Lee St
- 3119 Treville Ave
- 2329 Reynolds St
- 2806 Sherwood Dr
- 1009 K St
- 2806 & 2812 Evergreen Rd
- 3420 Brailsford Ave
- 2123 Ellis St