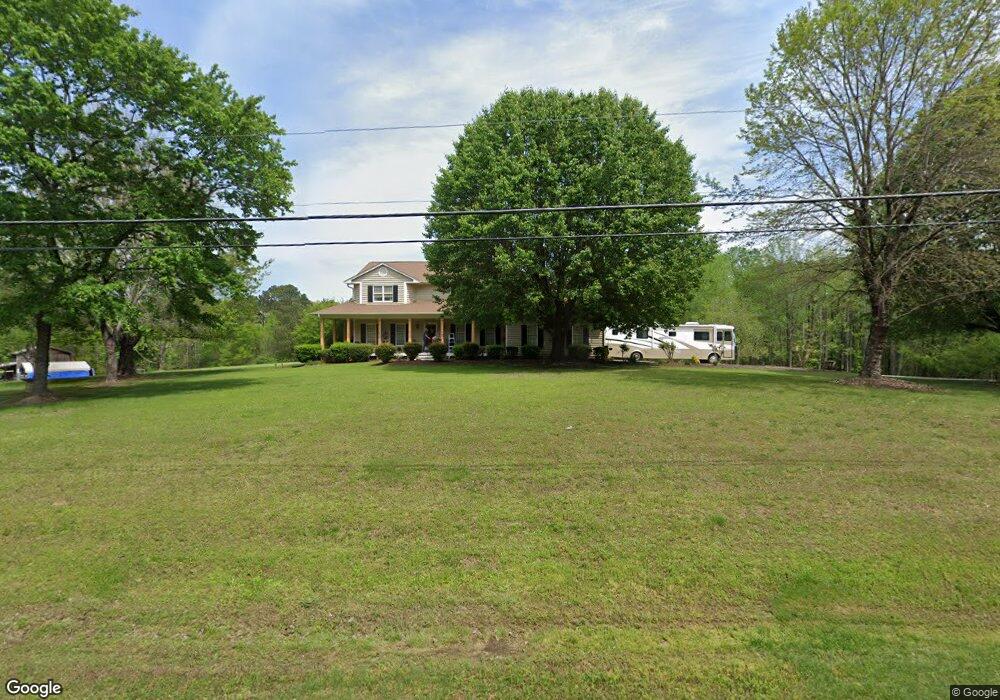
2712 Little Rogers Rd Durham, NC 27704
Eastern Durham NeighborhoodEstimated Value: $285,000 - $332,164
3
Beds
1
Bath
1,488
Sq Ft
$209/Sq Ft
Est. Value
About This Home
This home is located at 2712 Little Rogers Rd, Durham, NC 27704 and is currently estimated at $310,791, approximately $208 per square foot. 2712 Little Rogers Rd is a home located in Durham County with nearby schools including Glenn Elementary, John W Neal Middle School, and Southern School of Energy & Sustainability.
Ownership History
Date
Name
Owned For
Owner Type
Purchase Details
Closed on
Aug 19, 2020
Sold by
Reynolds Jeffrey and Reynolds Elizabeth
Bought by
Wilder David Keith and Wilder Sommer Erowid
Current Estimated Value
Home Financials for this Owner
Home Financials are based on the most recent Mortgage that was taken out on this home.
Original Mortgage
$207,000
Outstanding Balance
$183,624
Interest Rate
3%
Mortgage Type
New Conventional
Estimated Equity
$127,167
Purchase Details
Closed on
Oct 11, 2015
Sold by
Alvarado Christine and Alvarado Barahona Greivin Arturo
Bought by
Reynolds Jeffrey and Reynolds Elizabeth
Purchase Details
Closed on
May 31, 2011
Sold by
Fannie Mae
Bought by
Smith Christine
Home Financials for this Owner
Home Financials are based on the most recent Mortgage that was taken out on this home.
Original Mortgage
$105,457
Interest Rate
4.62%
Mortgage Type
FHA
Purchase Details
Closed on
Jul 20, 2010
Sold by
Mcvicker John
Bought by
Federal National Mortgage Association
Create a Home Valuation Report for This Property
The Home Valuation Report is an in-depth analysis detailing your home's value as well as a comparison with similar homes in the area
Home Values in the Area
Average Home Value in this Area
Purchase History
| Date | Buyer | Sale Price | Title Company |
|---|---|---|---|
| Wilder David Keith | $240,000 | None Available | |
| Reynolds Jeffrey | $120,000 | Attorney | |
| Smith Christine | -- | None Available | |
| Federal National Mortgage Association | $105,799 | None Available |
Source: Public Records
Mortgage History
| Date | Status | Borrower | Loan Amount |
|---|---|---|---|
| Open | Wilder David Keith | $207,000 | |
| Previous Owner | Smith Christine | $105,457 |
Source: Public Records
Tax History Compared to Growth
Tax History
| Year | Tax Paid | Tax Assessment Tax Assessment Total Assessment is a certain percentage of the fair market value that is determined by local assessors to be the total taxable value of land and additions on the property. | Land | Improvement |
|---|---|---|---|---|
| 2025 | $2,068 | $384,876 | $165,320 | $219,556 |
| 2024 | $2,068 | $187,639 | $56,737 | $130,902 |
| 2023 | $1,939 | $187,639 | $56,737 | $130,902 |
| 2022 | $1,846 | $187,639 | $56,737 | $130,902 |
| 2021 | $1,585 | $187,639 | $56,737 | $130,902 |
| 2020 | $1,566 | $187,639 | $56,737 | $130,902 |
| 2019 | $1,566 | $187,639 | $56,737 | $130,902 |
| 2018 | $1,320 | $144,664 | $52,380 | $92,284 |
| 2017 | $1,305 | $144,664 | $52,380 | $92,284 |
| 2016 | $1,266 | $144,664 | $52,380 | $92,284 |
| 2015 | $1,142 | $107,629 | $34,402 | $73,227 |
| 2014 | $1,142 | $107,629 | $34,402 | $73,227 |
Source: Public Records
Map
Nearby Homes
- 2204 Fletchers Ridge Dr
- 4103 Cheek Rd
- 1828 Fletchers Chapel Rd
- 503 Santee Rd
- 1104 Pebblestone Dr
- 608 Clearfield Dr
- 4300-4304 Cheek Rd
- 3721 Brightwood Ln
- 505 Santee Rd
- 1212 Opal Ln
- 1213 Opal Ln
- 721 Pebblestone Dr
- 1209 Opal Ln
- 1205 Opal Ln
- 1201 Opal Ln
- 1201 Opal Ln Unit 77
- 2901 Burton Rd
- 112 Eastern Teal Dr
- 221 Santee Rd
- 2651 Burton Rd
- 2708 Little Rogers Rd
- 2730 Little Rogers Rd
- 2714 Little Rogers Rd
- 2514 Little Rogers Rd
- 2233 Dandy Dr
- 2508 Little Rogers Rd
- 2717 Little Rogers Rd
- 5509 Nob Hill Rd
- 2727 Little Rogers Rd
- 2801 Little Rogers Rd
- 2803 Little Rogers Rd
- 2500 Little Rogers Rd
- 2813 Little Rogers Rd
- 0 Little Rogers Rd
- 5512 Nob Hill Rd
- 5521 Nob Hill Rd
- 2817 Little Rogers Rd
- 2821 Little Rogers Rd
- 5603 Nob Hill Rd
- 2416 Little Rogers Rd