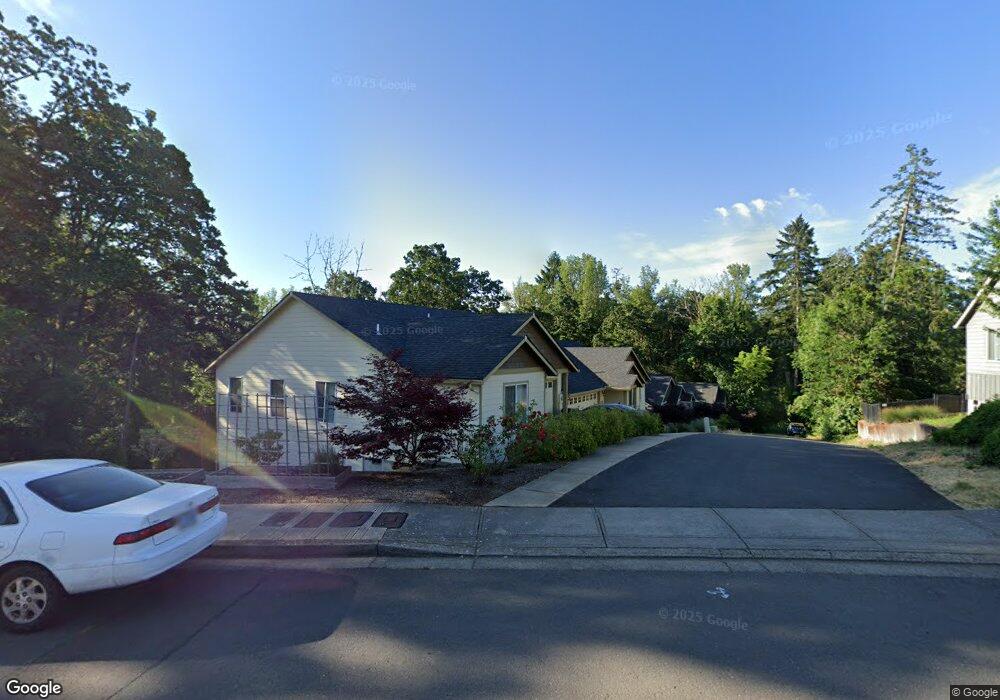
2712 Van Kleeck Place NW Unit 19 Salem, OR 97304
West Salem NeighborhoodEstimated Value: $392,000 - $408,000
3
Beds
2
Baths
1,230
Sq Ft
$323/Sq Ft
Est. Value
About This Home
This home is located at 2712 Van Kleeck Place NW Unit 19, Salem, OR 97304 and is currently estimated at $397,787, approximately $323 per square foot. 2712 Van Kleeck Place NW Unit 19 is a home located in Polk County with nearby schools including Brush College Elementary School, Straub Middle School, and West Salem High School.
Ownership History
Date
Name
Owned For
Owner Type
Purchase Details
Closed on
Jan 20, 2023
Sold by
Starr Lauren
Bought by
Cox Mackenzie Nicole and Cox Michael Alexander
Current Estimated Value
Home Financials for this Owner
Home Financials are based on the most recent Mortgage that was taken out on this home.
Original Mortgage
$293,440
Outstanding Balance
$284,165
Interest Rate
6.48%
Mortgage Type
New Conventional
Estimated Equity
$113,622
Purchase Details
Closed on
Sep 8, 2021
Sold by
Ferrari Tara
Bought by
Starr Lauren
Home Financials for this Owner
Home Financials are based on the most recent Mortgage that was taken out on this home.
Original Mortgage
$321,199
Interest Rate
2.8%
Mortgage Type
FHA
Purchase Details
Closed on
Feb 6, 2017
Sold by
3G S Construction Inc
Bought by
Ferrari Tara
Create a Home Valuation Report for This Property
The Home Valuation Report is an in-depth analysis detailing your home's value as well as a comparison with similar homes in the area
Home Values in the Area
Average Home Value in this Area
Purchase History
| Date | Buyer | Sale Price | Title Company |
|---|---|---|---|
| Cox Mackenzie Nicole | $366,800 | First American Title | |
| Starr Lauren | $345,000 | First American Title | |
| Ferrari Tara | $234,900 | Fidelity Natl Title Co Of Or |
Source: Public Records
Mortgage History
| Date | Status | Borrower | Loan Amount |
|---|---|---|---|
| Open | Cox Mackenzie Nicole | $293,440 | |
| Previous Owner | Starr Lauren | $321,199 |
Source: Public Records
Tax History Compared to Growth
Tax History
| Year | Tax Paid | Tax Assessment Tax Assessment Total Assessment is a certain percentage of the fair market value that is determined by local assessors to be the total taxable value of land and additions on the property. | Land | Improvement |
|---|---|---|---|---|
| 2025 | $3,465 | $189,360 | $45,770 | $143,590 |
| 2024 | $3,465 | $183,850 | $44,430 | $139,420 |
| 2023 | $3,364 | $178,500 | $43,130 | $135,370 |
| 2022 | $3,257 | $173,310 | $41,880 | $131,430 |
| 2021 | $3,164 | $168,270 | $40,660 | $127,610 |
| 2020 | $3,070 | $163,370 | $39,470 | $123,900 |
| 2019 | $2,963 | $158,620 | $38,320 | $120,300 |
| 2018 | $2,914 | $154,000 | $37,210 | $116,790 |
| 2017 | $2,626 | $149,520 | $36,130 | $113,390 |
| 2016 | $393 | $22,250 | $22,250 | $0 |
Source: Public Records
Map
Nearby Homes
- 2775 Wallace Hills Ct NW
- 0 Wallace Rd NW Unit 468567809
- 2858 Oakcrest Dr NW Unit 9
- 2959 Vick Ave NW
- 2438 Whetstone Ct NW
- 0 Morrow Ct NW Unit 715467966
- 2165 Teakwood Ave NW
- 2388 Westminster Ave NW
- 2930 Eric Ct NW
- 2367 Wilark Dr NW
- 1835 Wakefield Ct NW
- 3074 Oakcrest Dr NW
- 3012 Winslow Way NW Unit 3012
- 3043 Winslow Way NW
- 2263 Banyonwood Ave NW
- 2038 W Park Ct NW
- 2719 Cherry Hill Ct NW
- 2290 Morrow Ct NW
- 1602 Sunrise Cir NW
- 2230 Emmett Dr NW
- 2712 Van Kleeck Place NW
- 2700 van Kleeck (Block Of) Place
- 2708 Van Kleeck Place NW
- 1814 Brookside Ave NW
- 2706 Van Kleeck Place NW Unit 20
- 2706 Van Kleeck Place NW
- 2735 Van Kleeck Place NW
- 1815 Brookside Ave NW
- 2702 Van Kleeck Place NW
- 2722 Van Kleeck Place NW
- 1824 Brookside Ave NW
- 2745 Van Kleeck Place NW
- 1825 Brookside Ave NW
- 2732 Van Kleeck Place NW
- 1834 Brookside Ave NW
- 2755 Van Kleeck Place NW
- 2760 Wallace Hills Ct NW
- 1835 Brookside Ave NW
- 2742 Van Kleeck Place NW
- 2832 Van Kleeck Place NW