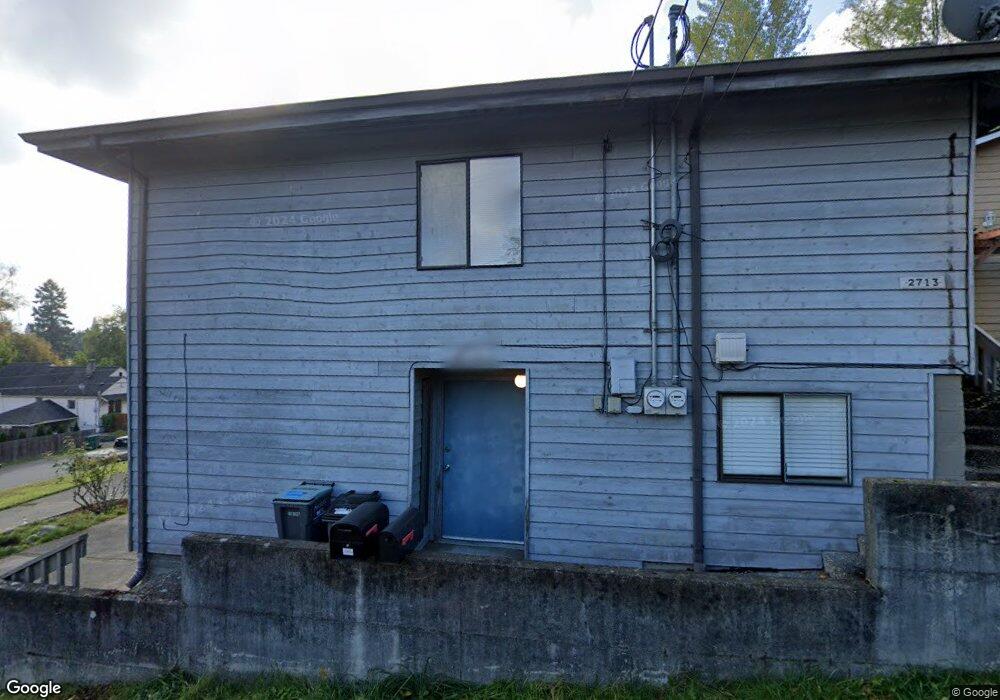
2713 19th St Bremerton, WA 98312
Estimated Value: $450,000 - $483,000
4
Beds
2
Baths
1,844
Sq Ft
$253/Sq Ft
Est. Value
About This Home
This home is located at 2713 19th St, Bremerton, WA 98312 and is currently estimated at $466,687, approximately $253 per square foot. 2713 19th St is a home located in Kitsap County with nearby schools including Crownhill Elementary School, Mountain View Middle School, and Bremerton High School.
Ownership History
Date
Name
Owned For
Owner Type
Purchase Details
Closed on
Jul 27, 2005
Sold by
Gannis Barbara H
Bought by
Schot Andrew W and Barker Mindy J
Current Estimated Value
Home Financials for this Owner
Home Financials are based on the most recent Mortgage that was taken out on this home.
Original Mortgage
$196,542
Outstanding Balance
$102,582
Interest Rate
5.56%
Mortgage Type
Seller Take Back
Estimated Equity
$364,105
Purchase Details
Closed on
Mar 10, 2003
Sold by
Gannis Barbara H
Bought by
Gannis Barbara H
Purchase Details
Closed on
Jul 7, 2000
Sold by
Gannis Barbara and Gannis Michael
Bought by
Gannis Barbara
Purchase Details
Closed on
Mar 30, 2000
Sold by
Natividad Ruth A
Bought by
Natividad Ruth A
Purchase Details
Closed on
Mar 5, 2000
Sold by
Natividad Frank
Bought by
Natividad Ruth A
Create a Home Valuation Report for This Property
The Home Valuation Report is an in-depth analysis detailing your home's value as well as a comparison with similar homes in the area
Home Values in the Area
Average Home Value in this Area
Purchase History
| Date | Buyer | Sale Price | Title Company |
|---|---|---|---|
| Schot Andrew W | $196,822 | -- | |
| Gannis Barbara H | -- | -- | |
| Gannis Barbara | -- | -- | |
| Natividad Ruth A | -- | -- | |
| Natividad Ruth A | -- | -- |
Source: Public Records
Mortgage History
| Date | Status | Borrower | Loan Amount |
|---|---|---|---|
| Open | Schot Andrew W | $196,542 |
Source: Public Records
Tax History Compared to Growth
Tax History
| Year | Tax Paid | Tax Assessment Tax Assessment Total Assessment is a certain percentage of the fair market value that is determined by local assessors to be the total taxable value of land and additions on the property. | Land | Improvement |
|---|---|---|---|---|
| 2026 | $3,570 | $404,720 | $81,730 | $322,990 |
| 2025 | $3,570 | $404,720 | $81,730 | $322,990 |
| 2024 | $3,445 | $404,720 | $81,730 | $322,990 |
| 2023 | $3,561 | $404,720 | $81,730 | $322,990 |
| 2022 | $3,326 | $339,820 | $68,100 | $271,720 |
| 2021 | $2,891 | $270,310 | $51,370 | $218,940 |
| 2020 | $2,690 | $251,360 | $47,540 | $203,820 |
| 2019 | $2,325 | $225,080 | $42,440 | $182,640 |
| 2018 | $2,449 | $153,000 | $31,910 | $121,090 |
| 2017 | $2,004 | $153,000 | $31,910 | $121,090 |
| 2016 | $1,878 | $135,740 | $27,990 | $107,750 |
| 2015 | $1,530 | $110,010 | $30,140 | $79,870 |
| 2014 | -- | $105,830 | $30,140 | $75,690 |
| 2013 | -- | $120,040 | $31,810 | $88,230 |
Source: Public Records
Map
Nearby Homes
- 1714 N Wycoff Ave
- 1551 N Callow Ave
- 3173 19th St
- 1948 N Rainier Ave
- 2011 Taft Ave
- 2150 N Callow Ave
- 2117 E Phinney Bay Dr
- 1602 Naval Ave Unit 27
- 0 Thompson Dr
- 1103 N Wycoff Ave Unit A
- 1325 Marguerite Ave
- 1515 Pennsylvania Ave
- 2540 E Phinney Bay Place
- 1309 Times Ave
- 1303 Times Ave
- 10 XX Naval Ave
- 1135 Morgan Rd NW Unit A & B
- 10xx Naval Ave
- 1448 17th St
- 1818 Jackson Dr
- 1747 N Callow Ave
- 1903 N Callow Ave
- 2715 19th St
- 1745 N Callow Ave
- 1741 N Callow Ave
- 1743 N Callow Ave
- 2647 19th St
- 1744 N Callow Ave
- 1911 N Callow Ave
- 2716 19th St
- 1748 N Wycoff Ave
- 1906 N Callow Ave
- 1908 N Wycoff Ave
- 1906 N Wycoff Ave
- 1906 N Wycoff Ave Unit A&B
- 2616 19th St
- 1915 N Callow Ave
- 2615 19th St