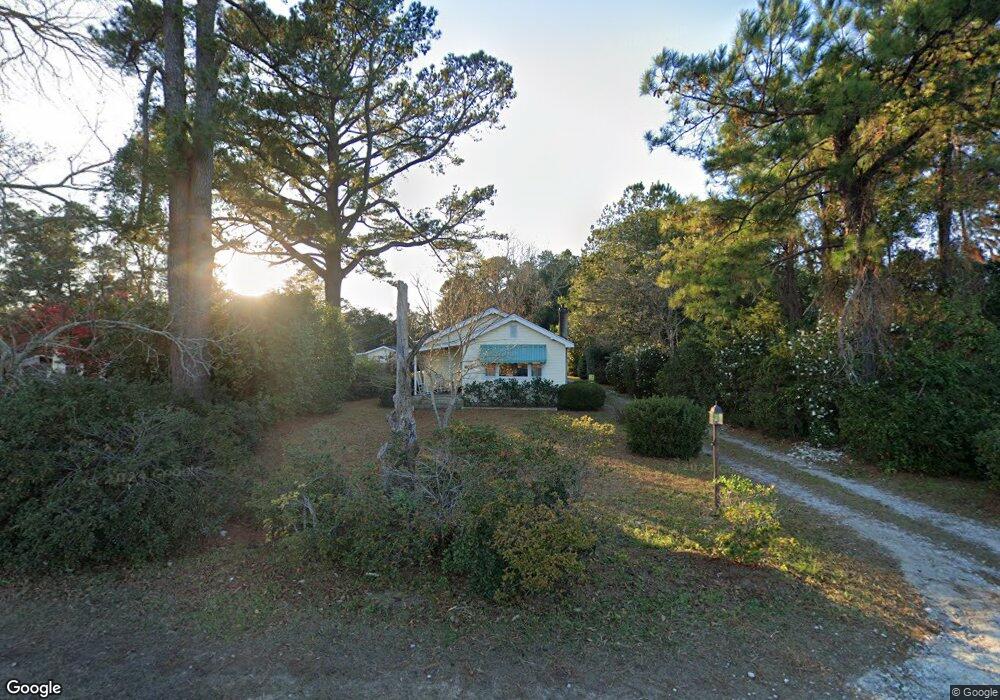
2713 Castle Hayne Rd Wilmington, NC 28401
Estimated Value: $278,770 - $403,000
1
Bed
1
Bath
1,347
Sq Ft
$254/Sq Ft
Est. Value
About This Home
This home is located at 2713 Castle Hayne Rd, Wilmington, NC 28401 and is currently estimated at $342,443, approximately $254 per square foot. 2713 Castle Hayne Rd is a home located in New Hanover County with nearby schools including Wrightsboro Elementary School, Holly Shelter Middle School, and New Hanover High School.
Ownership History
Date
Name
Owned For
Owner Type
Purchase Details
Closed on
Nov 10, 2005
Sold by
Nucci Vincent Patrick
Bought by
Nucci Susan
Current Estimated Value
Purchase Details
Closed on
Oct 11, 2004
Sold by
Nucci Willa Mincey
Bought by
Nucci Vicent Patrick
Purchase Details
Closed on
Feb 5, 2002
Sold by
Bank One Na
Bought by
Nucci Vincent Patrick Willa
Purchase Details
Closed on
Sep 25, 2001
Sold by
Ells Elizabeth B Sub Trustee
Bought by
Bank One Na
Purchase Details
Closed on
Feb 3, 1997
Sold by
Cheramie Janet J Eugene J
Bought by
Gales Sean Patrick Angela L
Purchase Details
Closed on
Nov 15, 1993
Sold by
Jordan Frederick R Ii Ann F
Bought by
Cheramie Janet J
Purchase Details
Closed on
Jul 17, 1989
Sold by
Rivenbark H C Sr Hrs
Bought by
Jordan Frederick R Ii Ann F
Purchase Details
Closed on
Dec 1, 1988
Sold by
Rivenbark Sr H C
Bought by
Rivenbark H C Sr Hrs
Purchase Details
Closed on
Jan 1, 1948
Bought by
Rivenbark H C
Create a Home Valuation Report for This Property
The Home Valuation Report is an in-depth analysis detailing your home's value as well as a comparison with similar homes in the area
Home Values in the Area
Average Home Value in this Area
Purchase History
| Date | Buyer | Sale Price | Title Company |
|---|---|---|---|
| Nucci Susan | -- | None Available | |
| Nucci Vicent Patrick | -- | -- | |
| Nucci Vincent Patrick Willa | $61,500 | -- | |
| Bank One Na | $65,000 | -- | |
| Gales Sean Patrick Angela L | $79,000 | -- | |
| Cheramie Janet J | -- | -- | |
| Jordan Frederick R Ii Ann F | $45,000 | -- | |
| Rivenbark H C Sr Hrs | -- | -- | |
| Rivenbark H C | -- | -- |
Source: Public Records
Tax History Compared to Growth
Tax History
| Year | Tax Paid | Tax Assessment Tax Assessment Total Assessment is a certain percentage of the fair market value that is determined by local assessors to be the total taxable value of land and additions on the property. | Land | Improvement |
|---|---|---|---|---|
| 2025 | $791 | $283,800 | $82,800 | $201,000 |
| 2023 | $791 | $137,200 | $52,200 | $85,000 |
| 2022 | $792 | $137,200 | $52,200 | $85,000 |
| 2021 | $763 | $137,200 | $52,200 | $85,000 |
| 2020 | $624 | $98,700 | $38,000 | $60,700 |
| 2019 | $624 | $98,700 | $38,000 | $60,700 |
| 2018 | $624 | $98,700 | $38,000 | $60,700 |
| 2017 | $639 | $98,700 | $38,000 | $60,700 |
| 2016 | $690 | $99,500 | $38,000 | $61,500 |
| 2015 | $641 | $99,500 | $38,000 | $61,500 |
| 2014 | $630 | $99,500 | $38,000 | $61,500 |
Source: Public Records
Map
Nearby Homes
- 100 Whitman Ave
- 112 Whitman Ave
- 3512 N Kerr Ave
- 1629 Riverside Dr
- 1511 Riverside Dr
- 1637 Riverside Dr
- 121 Laurel Dr
- 163 Horne Place Dr
- 425 Tributary Cir
- 408 Tributary Cir
- 132 Tributary Cir
- 164 Horne Place Dr
- 158 Tributary Cir
- 2319 Castle Hayne Rd
- 240 Windy Woods Way
- 808 Delta Ct
- 1521 Oakley Rd
- 3220 Beaus Dr
- 3220 Beaus Dr Unit 34
- 3224 Beaus Dr
- 2711 Castle Hayne Rd
- 2705 Castle Hayne Rd
- 2701 Castle Hayne Rd
- 2723 Castle Hayne Rd
- 2717 Castle Hayne Rd
- 2717 Castle Hayne Rd
- 100 Harrells Ln
- 111 Horne Place Dr
- 2715 Castle Hayne Rd
- 2636 Castle Hayne Rd
- 115 Horne Place Dr
- 2731 Castle Hayne Rd
- 114 Harrells Ln
- 119 Horne Place Dr
- 10 Sheridan Dr
- 2630 Castle Hayne Rd
- 110 Horne Place Dr
- 103 Whitman Ave
- 2623 Castle Hayne Rd