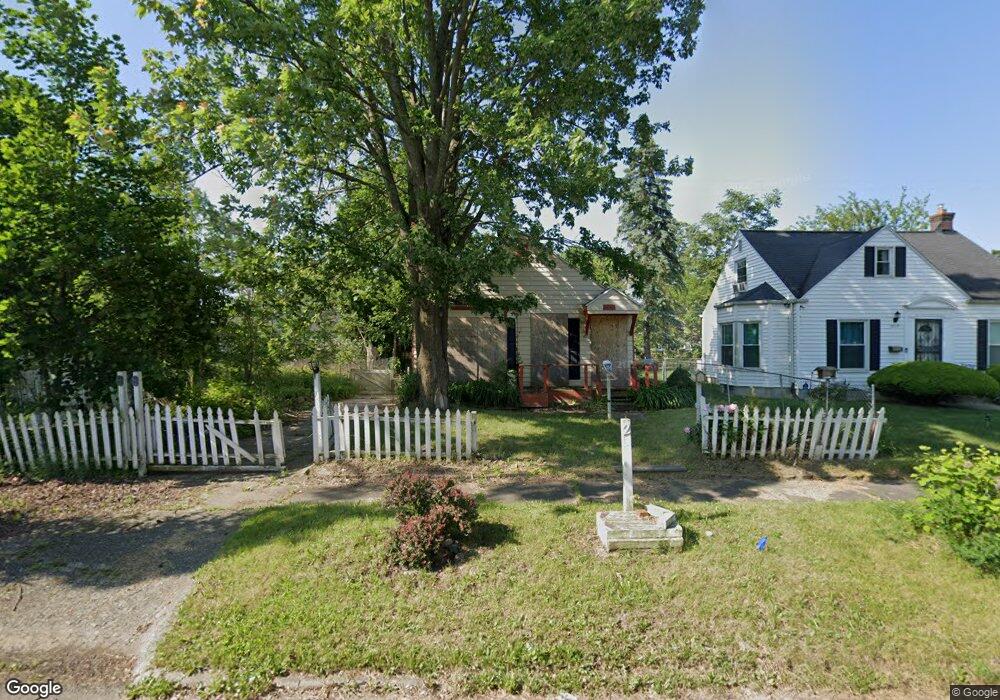
2713 Concord St Flint, MI 48504
Ballenger Highway NeighborhoodEstimated Value: $31,000 - $58,000
2
Beds
2
Baths
728
Sq Ft
$61/Sq Ft
Est. Value
About This Home
This home is located at 2713 Concord St, Flint, MI 48504 and is currently estimated at $44,296, approximately $60 per square foot. 2713 Concord St is a home located in Genesee County with nearby schools including Brownell STEM Academy, Greater Heights Academy, and St John Vianney Catholic School.
Ownership History
Date
Name
Owned For
Owner Type
Purchase Details
Closed on
Mar 10, 2020
Sold by
Elite Professional Management Llc
Bought by
Golden State Investments By Mj Llc
Current Estimated Value
Purchase Details
Closed on
Sep 26, 2019
Sold by
Cherry Deborah L
Bought by
Elite Professional Management Llc
Purchase Details
Closed on
Nov 4, 2014
Sold by
Stonecrest Income & Opportunity Fund I L
Bought by
Harrell Ramona Diane
Purchase Details
Closed on
Oct 31, 2012
Sold by
Springleaf Financial Services Inc
Bought by
Stonecrest Income & Opportunity Fund I L
Purchase Details
Closed on
Mar 7, 2012
Sold by
Vaughan Vi Ann and Vaughan Vi A
Bought by
Springleaf Financial Services Inc and American General Financial Services De I
Create a Home Valuation Report for This Property
The Home Valuation Report is an in-depth analysis detailing your home's value as well as a comparison with similar homes in the area
Home Values in the Area
Average Home Value in this Area
Purchase History
| Date | Buyer | Sale Price | Title Company |
|---|---|---|---|
| Golden State Investments By Mj Llc | $20,000 | None Available | |
| Elite Professional Management Llc | $3,800 | None Available | |
| Harrell Ramona Diane | $1,500 | None Available | |
| Stonecrest Income & Opportunity Fund I L | $1,000 | None Available | |
| Springleaf Financial Services Inc | $3,000 | None Available |
Source: Public Records
Tax History Compared to Growth
Tax History
| Year | Tax Paid | Tax Assessment Tax Assessment Total Assessment is a certain percentage of the fair market value that is determined by local assessors to be the total taxable value of land and additions on the property. | Land | Improvement |
|---|---|---|---|---|
| 2025 | $1,029 | $18,800 | $0 | $0 |
| 2024 | $956 | $15,000 | $0 | $0 |
| 2023 | $936 | $11,000 | $0 | $0 |
| 2022 | $0 | $9,700 | $0 | $0 |
| 2021 | $876 | $8,400 | $0 | $0 |
| 2020 | $812 | $8,300 | $0 | $0 |
| 2019 | $600 | $7,600 | $0 | $0 |
| 2018 | $1,678 | $8,400 | $0 | $0 |
| 2017 | $1,098 | $0 | $0 | $0 |
| 2016 | $684 | $0 | $0 | $0 |
| 2015 | -- | $0 | $0 | $0 |
| 2014 | -- | $0 | $0 | $0 |
| 2012 | -- | $9,100 | $0 | $0 |
Source: Public Records
Map
Nearby Homes
- 2709 Mallery St
- 2622 Concord St
- 2714 Barth St
- 2612 Concord St
- 2812 Concord St
- 2526 Concord St
- 2840 Mallery St
- 2725 Prospect St
- 2425 Clement St
- 1315 Welch Blvd
- 2424 Begole St
- 2902 Prospect St
- 2952 Clement St
- 2606 Stevenson St
- 2730 Berkley St
- 2302 Mallery St
- 1413 Greenway Ave
- 1220 Forest Hill Ave
- 1909 Proctor Ave
- 2930 Prospect St
- 2709 Concord St
- 2717 Concord St
- 2721 Concord St
- 2714 Clement St
- 2718 Clement St
- 2710 Clement St
- 2722 Clement St
- 2701 Concord St
- 2706 Clement St
- 1486 Lavender Ave
- 3643 Concord
- 2714 Concord St
- 2710 Concord St
- 2718 Concord St
- 2702 Clement St
- 1476 Lavender Ave
- 2706 Concord St
- 2629 Concord St
- 2722 Concord St
- 2702 Concord St