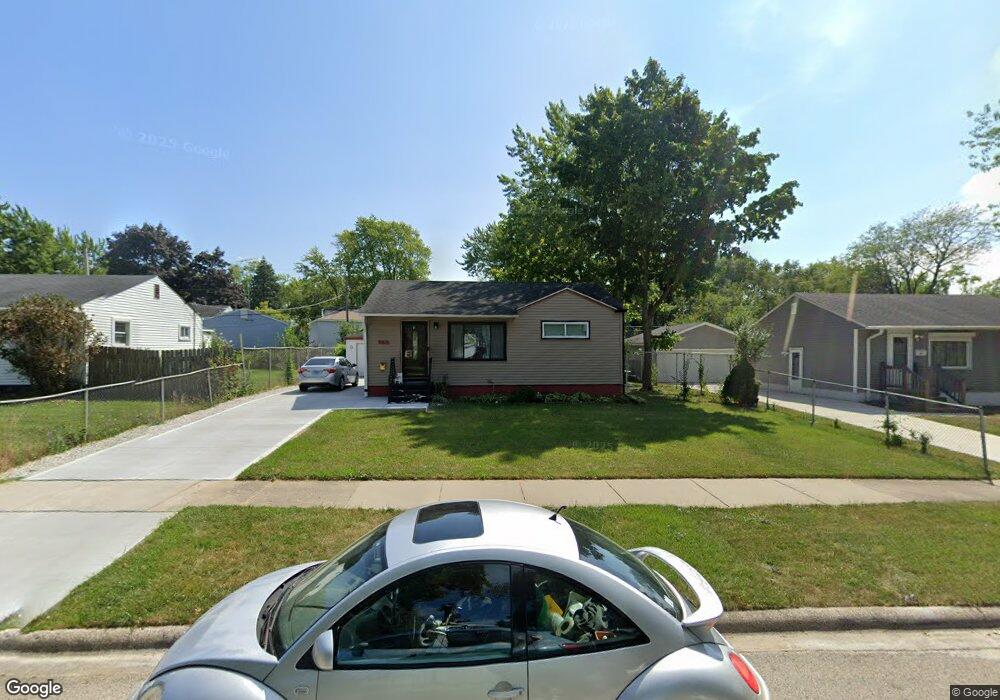
2713 Mohawk Rd Waukegan, IL 60087
Lake Cogardens NeighborhoodEstimated Value: $194,000 - $215,066
2
Beds
2
Baths
768
Sq Ft
$270/Sq Ft
Est. Value
About This Home
This home is located at 2713 Mohawk Rd, Waukegan, IL 60087 and is currently estimated at $207,017, approximately $269 per square foot. 2713 Mohawk Rd is a home located in Lake County with nearby schools including Oakdale Elementary School, Miguel Juarez Middle School, and Waukegan High School.
Ownership History
Date
Name
Owned For
Owner Type
Purchase Details
Closed on
Nov 7, 2011
Sold by
Nava Delia and Barrera Sandra
Bought by
Mendoza Minerva
Current Estimated Value
Purchase Details
Closed on
Aug 5, 2003
Sold by
Nava Delia and Beltran Sofia
Bought by
Nava Delia and Barrera Sandra
Purchase Details
Closed on
Apr 25, 2002
Sold by
Campos Miguel and Rubi Juan
Bought by
Nava Delia and Beltran Sofia
Home Financials for this Owner
Home Financials are based on the most recent Mortgage that was taken out on this home.
Original Mortgage
$111,938
Interest Rate
6.87%
Mortgage Type
FHA
Purchase Details
Closed on
Jun 25, 1999
Sold by
Hanson Annette K
Bought by
Campos Miguel and Rubi Juan
Home Financials for this Owner
Home Financials are based on the most recent Mortgage that was taken out on this home.
Original Mortgage
$96,662
Interest Rate
7.54%
Mortgage Type
FHA
Create a Home Valuation Report for This Property
The Home Valuation Report is an in-depth analysis detailing your home's value as well as a comparison with similar homes in the area
Home Values in the Area
Average Home Value in this Area
Purchase History
| Date | Buyer | Sale Price | Title Company |
|---|---|---|---|
| Mendoza Minerva | $44,000 | Success Title Services Inc | |
| Nava Delia | -- | -- | |
| Nava Delia | $114,000 | Ticor Title | |
| Campos Miguel | $98,000 | -- |
Source: Public Records
Mortgage History
| Date | Status | Borrower | Loan Amount |
|---|---|---|---|
| Previous Owner | Nava Delia | $111,938 | |
| Previous Owner | Campos Miguel | $96,662 |
Source: Public Records
Tax History Compared to Growth
Tax History
| Year | Tax Paid | Tax Assessment Tax Assessment Total Assessment is a certain percentage of the fair market value that is determined by local assessors to be the total taxable value of land and additions on the property. | Land | Improvement |
|---|---|---|---|---|
| 2024 | $3,435 | $58,032 | $8,013 | $50,019 |
| 2023 | $3,485 | $52,424 | $7,238 | $45,186 |
| 2022 | $3,485 | $41,648 | $6,896 | $34,752 |
| 2021 | $3,170 | $36,401 | $5,969 | $30,432 |
| 2020 | $3,164 | $33,912 | $5,561 | $28,351 |
| 2019 | $3,132 | $31,075 | $5,096 | $25,979 |
| 2018 | $2,439 | $25,245 | $6,492 | $18,753 |
| 2017 | $2,324 | $22,335 | $5,744 | $16,591 |
| 2016 | $2,072 | $19,408 | $4,991 | $14,417 |
| 2015 | $1,921 | $17,370 | $4,467 | $12,903 |
| 2014 | $1,427 | $13,969 | $4,903 | $9,066 |
| 2012 | $1,402 | $15,136 | $5,312 | $9,824 |
Source: Public Records
Map
Nearby Homes
- 2713 Varonen Ave
- 2928 W Country Club Ave
- 3000 W Country Club Ave
- 2946 W Country Club Ave
- 1913 Chippewa Rd
- 2440 W Cheyenne Rd
- 2715 W Greenwood Ave
- 2705 Dana Ave
- 3320 Sunset Ave
- 2708 Dana Ave
- 3032 W Vermont Ave
- 2810 W Atlantic Ave
- 2207 Williamsburg Dr
- 2350 N Lewis Ave
- 36955 N Garrick Ave
- 12312 W Audrey Ave
- 12352 W Atlantic Ave
- 2008 Harding Ave
- 12933 W Polo Ave
- 2009 Harding Ave
- 2717 Mohawk Rd
- 2709 Mohawk Rd
- 2712 Iroquois Rd
- 2721 Mohawk Rd
- 2705 Mohawk Rd
- 2708 Iroquois Rd
- 2716 Mohawk Rd
- 2716 Iroquois Rd Unit 2
- 2712 Mohawk Rd
- 2720 Mohawk Rd
- 2701 Mohawk Rd
- 2708 Mohawk Rd
- 2704 Iroquois Rd
- 2720 Iroquois Rd
- 2725 Mohawk Rd
- 2724 Mohawk Rd
- 2117 Indian Rd Unit 2
- 2704 Mohawk Rd
- 2113 Indian Rd
- 2639 Mohawk Rd