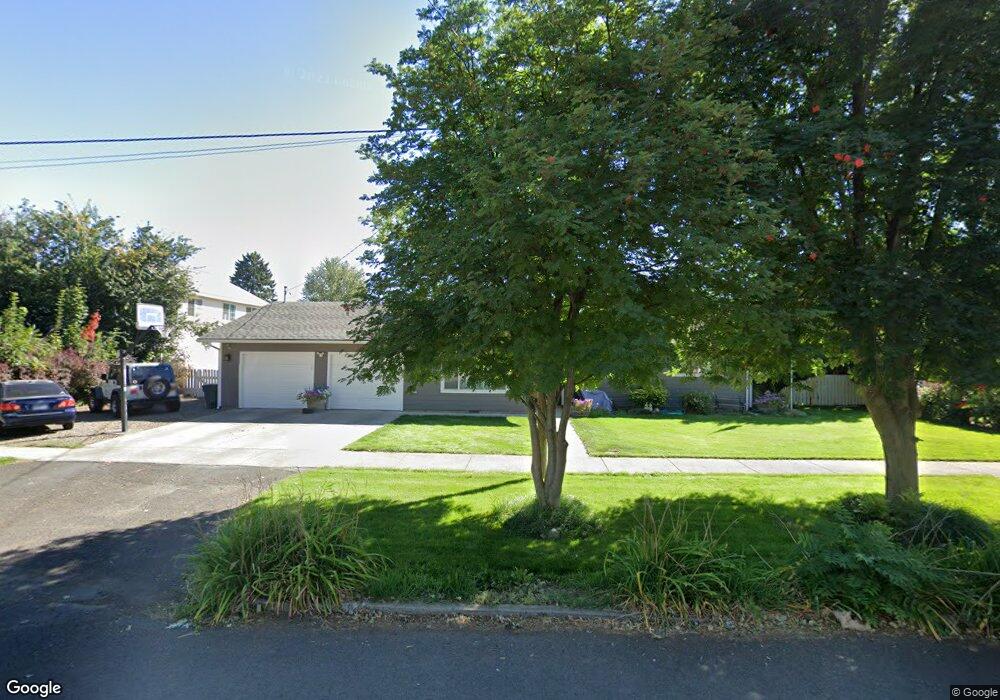
2713 N Ash St La Grande, OR 97850
Estimated Value: $328,000 - $351,669
3
Beds
2
Baths
1,508
Sq Ft
$225/Sq Ft
Est. Value
About This Home
This home is located at 2713 N Ash St, La Grande, OR 97850 and is currently estimated at $339,835, approximately $225 per square foot. 2713 N Ash St is a home located in Union County with nearby schools including La Grande High School, The Marian Academy, and Grande Ronde Academy.
Ownership History
Date
Name
Owned For
Owner Type
Purchase Details
Closed on
Aug 20, 2008
Sold by
Barlet David J and Barlet Peggy Ann
Bought by
Harnack Rocbert A and Harnack Jessica
Current Estimated Value
Home Financials for this Owner
Home Financials are based on the most recent Mortgage that was taken out on this home.
Original Mortgage
$138,775
Outstanding Balance
$90,813
Interest Rate
6.27%
Mortgage Type
New Conventional
Estimated Equity
$249,022
Create a Home Valuation Report for This Property
The Home Valuation Report is an in-depth analysis detailing your home's value as well as a comparison with similar homes in the area
Home Values in the Area
Average Home Value in this Area
Purchase History
| Date | Buyer | Sale Price | Title Company |
|---|---|---|---|
| Harnack Rocbert A | $136,000 | Abstract & Title Company |
Source: Public Records
Mortgage History
| Date | Status | Borrower | Loan Amount |
|---|---|---|---|
| Open | Harnack Rocbert A | $138,775 |
Source: Public Records
Tax History Compared to Growth
Tax History
| Year | Tax Paid | Tax Assessment Tax Assessment Total Assessment is a certain percentage of the fair market value that is determined by local assessors to be the total taxable value of land and additions on the property. | Land | Improvement |
|---|---|---|---|---|
| 2024 | $3,579 | $193,270 | $50,560 | $142,710 |
| 2023 | $3,518 | $187,650 | $49,090 | $138,560 |
| 2022 | $3,427 | $182,186 | $47,653 | $134,533 |
| 2021 | $3,343 | $176,880 | $46,719 | $130,161 |
| 2020 | $3,212 | $171,729 | $45,391 | $126,338 |
| 2019 | $3,147 | $166,728 | $44,273 | $122,455 |
| 2018 | $2,967 | $161,872 | $43,247 | $118,625 |
| 2017 | $2,882 | $157,158 | $37,463 | $119,695 |
| 2016 | $2,796 | $152,581 | $36,437 | $116,144 |
| 2015 | $2,695 | $148,137 | $35,279 | $112,858 |
| 2014 | $2,341 | $143,823 | $34,397 | $109,426 |
| 2013 | -- | $139,634 | $33,512 | $106,122 |
Source: Public Records
Map
Nearby Homes