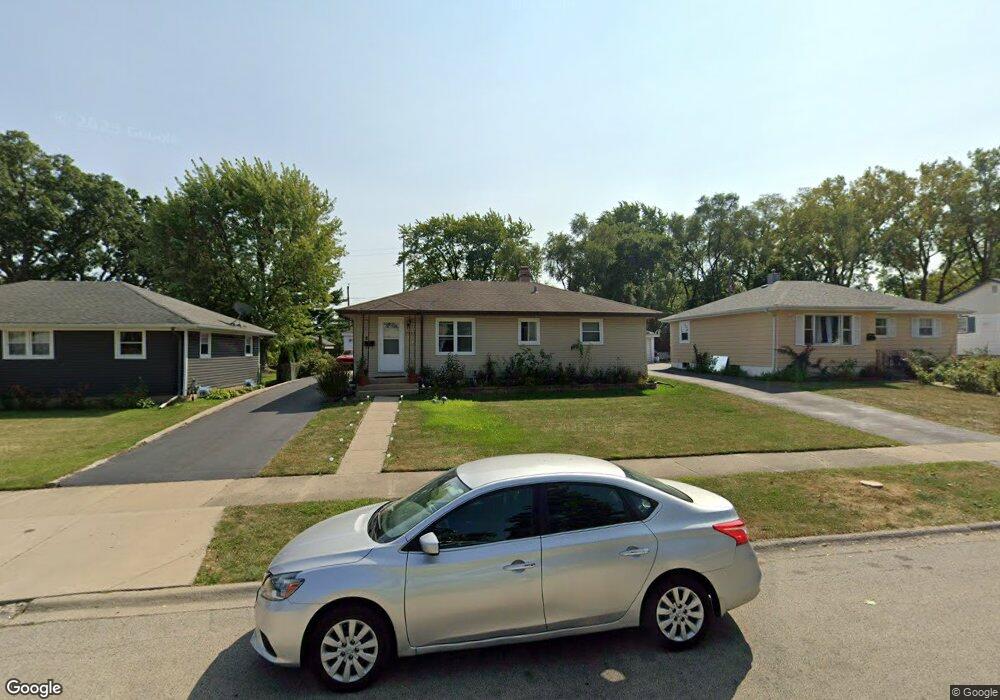
2713 W Cheyenne Rd Waukegan, IL 60087
Lake Cogardens NeighborhoodEstimated Value: $229,000 - $262,000
3
Beds
1
Bath
1,040
Sq Ft
$234/Sq Ft
Est. Value
About This Home
This home is located at 2713 W Cheyenne Rd, Waukegan, IL 60087 and is currently estimated at $243,454, approximately $234 per square foot. 2713 W Cheyenne Rd is a home located in Lake County with nearby schools including Clearview Elementary School, Miguel Juarez Middle School, and Waukegan High School.
Ownership History
Date
Name
Owned For
Owner Type
Purchase Details
Closed on
Apr 29, 2002
Sold by
Carvajal Jose
Bought by
Deoca Lorenza Montes
Current Estimated Value
Purchase Details
Closed on
Jun 12, 1997
Sold by
Reitman Michael J and Reitman Sandra M
Bought by
Montes Carvajal Jose and Montes Deoca Lorenza
Home Financials for this Owner
Home Financials are based on the most recent Mortgage that was taken out on this home.
Original Mortgage
$111,050
Interest Rate
8.13%
Mortgage Type
FHA
Purchase Details
Closed on
Apr 7, 1994
Sold by
Sanchez Jose I and Sanchez Jennifer A
Bought by
Reitman Michael J and Reitman Sandra M
Home Financials for this Owner
Home Financials are based on the most recent Mortgage that was taken out on this home.
Original Mortgage
$99,960
Interest Rate
7.35%
Mortgage Type
Assumption
Create a Home Valuation Report for This Property
The Home Valuation Report is an in-depth analysis detailing your home's value as well as a comparison with similar homes in the area
Home Values in the Area
Average Home Value in this Area
Purchase History
| Date | Buyer | Sale Price | Title Company |
|---|---|---|---|
| Deoca Lorenza Montes | -- | -- | |
| Montes Carvajal Jose | $112,000 | First American Title | |
| Reitman Michael J | $65,333 | -- |
Source: Public Records
Mortgage History
| Date | Status | Borrower | Loan Amount |
|---|---|---|---|
| Previous Owner | Montes Carvajal Jose | $111,050 | |
| Previous Owner | Reitman Michael J | $99,960 |
Source: Public Records
Tax History Compared to Growth
Tax History
| Year | Tax Paid | Tax Assessment Tax Assessment Total Assessment is a certain percentage of the fair market value that is determined by local assessors to be the total taxable value of land and additions on the property. | Land | Improvement |
|---|---|---|---|---|
| 2024 | $4,404 | $60,652 | $8,463 | $52,189 |
| 2023 | $3,732 | $54,700 | $7,633 | $47,067 |
| 2022 | $3,732 | $44,179 | $7,572 | $36,607 |
| 2021 | $3,989 | $44,263 | $7,556 | $36,707 |
| 2020 | $3,994 | $41,236 | $7,039 | $34,197 |
| 2019 | $3,967 | $37,786 | $6,450 | $31,336 |
| 2018 | $3,371 | $32,454 | $7,303 | $25,151 |
| 2017 | $3,231 | $28,713 | $6,461 | $22,252 |
| 2016 | $2,928 | $24,950 | $5,614 | $19,336 |
| 2015 | $2,759 | $22,331 | $5,025 | $17,306 |
| 2014 | $2,959 | $23,025 | $5,111 | $17,914 |
| 2012 | $3,887 | $24,946 | $5,538 | $19,408 |
Source: Public Records
Map
Nearby Homes
- 2715 W Greenwood Ave
- 2440 W Cheyenne Rd
- 1913 Chippewa Rd
- 2810 W Atlantic Ave
- 2928 W Country Club Ave
- 3000 W Country Club Ave
- 2946 W Country Club Ave
- 2207 Williamsburg Dr
- 12352 W Atlantic Ave
- 3320 Sunset Ave
- 2713 Varonen Ave
- 2813 Theresa Ave
- 2008 Harding Ave
- 2009 Harding Ave
- 2705 Dana Ave
- 2708 Dana Ave
- 3032 W Vermont Ave
- 12933 W Polo Ave
- 2350 N Lewis Ave
- 36955 N Garrick Ave
- 2719 W Cheyenne Rd
- 2709 W Cheyenne Rd
- 2725 W Cheyenne Rd
- 2705 W Cheyenne Rd
- 2708 W Greenwood Ave
- 2712 W Greenwood Ave
- 2704 W Greenwood Ave
- 2729 W Cheyenne Rd
- 2701 W Cheyenne Rd
- 2712 W Cheyenne Rd
- 2716 W Cheyenne Rd
- 2716 W Greenwood Ave
- 2708 W Cheyenne Rd
- 2700 W Greenwood Ave
- 2720 W Cheyenne Rd
- 2635 W Cheyenne Rd
- 2731 W Cheyenne Rd
- 2704 W Cheyenne Rd
- 2724 W Cheyenne Rd
- 2720 W Greenwood Ave