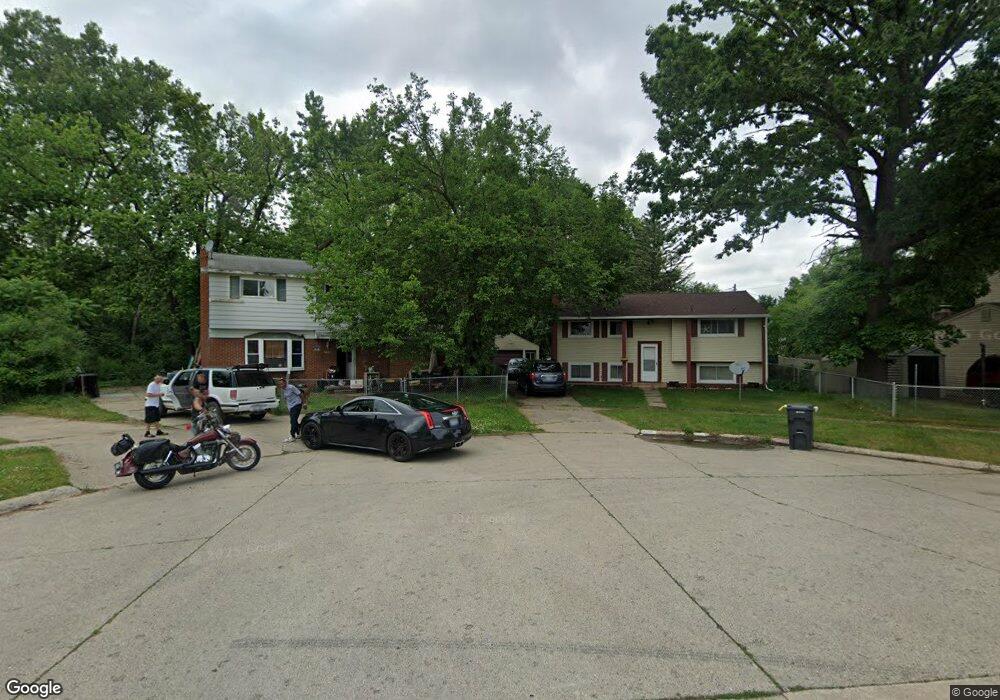
2713 Wilton Place Flint, MI 48506
Northeast Flint NeighborhoodEstimated Value: $67,000 - $76,000
4
Beds
2
Baths
1,910
Sq Ft
$38/Sq Ft
Est. Value
About This Home
This home is located at 2713 Wilton Place, Flint, MI 48506 and is currently estimated at $72,911, approximately $38 per square foot. 2713 Wilton Place is a home located in Genesee County with nearby schools including Brownell STEM Academy, Richfield Public School Academy, and Richfield Early Learning Center.
Ownership History
Date
Name
Owned For
Owner Type
Purchase Details
Closed on
Jun 20, 2014
Sold by
Morris Michael
Bought by
Morris Michael and Morris Teika
Current Estimated Value
Purchase Details
Closed on
Feb 15, 2011
Sold by
Morris Tyrone
Bought by
Morris Michael
Purchase Details
Closed on
Oct 28, 2009
Sold by
Mar Partners I
Bought by
Morris Tyrone
Purchase Details
Closed on
May 22, 2009
Sold by
Wells Fargo Bank Na
Bought by
Mar Partners 1
Purchase Details
Closed on
Jul 9, 2008
Sold by
Smith Bobby L
Bought by
Wells Fargo Bank Na and Option One Mortgage Loan Trust 2005-2 As
Purchase Details
Closed on
Mar 23, 2004
Sold by
Hud
Bought by
Smith Bobby L
Purchase Details
Closed on
Nov 6, 2002
Sold by
Ross Latricia J
Bought by
Countrywide Home Loans Inc
Purchase Details
Closed on
Nov 2, 2002
Sold by
Countrywide Home Loans Inc
Bought by
Hud
Purchase Details
Closed on
Dec 22, 1999
Sold by
Campbell L Campbell O and Campbell H
Bought by
Ross Latricia J
Create a Home Valuation Report for This Property
The Home Valuation Report is an in-depth analysis detailing your home's value as well as a comparison with similar homes in the area
Home Values in the Area
Average Home Value in this Area
Purchase History
| Date | Buyer | Sale Price | Title Company |
|---|---|---|---|
| Morris Michael | -- | None Available | |
| Morris Michael | -- | None Available | |
| Morris Tyrone | $6,000 | Lighthouse Title Inc | |
| Mar Partners 1 | -- | None Available | |
| Wells Fargo Bank Na | $34,000 | None Available | |
| Smith Bobby L | $45,000 | -- | |
| Countrywide Home Loans Inc | $82,002 | -- | |
| Hud | -- | -- | |
| Ross Latricia J | $69,000 | Sargents Title Company |
Source: Public Records
Tax History Compared to Growth
Tax History
| Year | Tax Paid | Tax Assessment Tax Assessment Total Assessment is a certain percentage of the fair market value that is determined by local assessors to be the total taxable value of land and additions on the property. | Land | Improvement |
|---|---|---|---|---|
| 2025 | $1,126 | $32,100 | $0 | $0 |
| 2024 | $1,016 | $27,000 | $0 | $0 |
| 2023 | $995 | $22,800 | $0 | $0 |
| 2022 | $0 | $16,300 | $0 | $0 |
| 2021 | $1,037 | $17,700 | $0 | $0 |
| 2020 | $931 | $14,000 | $0 | $0 |
| 2019 | $1,550 | $15,000 | $0 | $0 |
| 2018 | $1,016 | $15,400 | $0 | $0 |
| 2017 | $1,020 | $0 | $0 | $0 |
| 2016 | $1,013 | $0 | $0 | $0 |
| 2015 | -- | $0 | $0 | $0 |
| 2014 | -- | $0 | $0 | $0 |
| 2012 | -- | $21,100 | $0 | $0 |
Source: Public Records
Map
Nearby Homes
- 5501 Western Rd
- 2710 Eaton Place
- 2802 Eaton Place
- 5220 Western Rd
- 5919 Western Rd
- 2713 Alpha Way
- 2910 Hampstead Dr
- 2801 Epsilon Trail
- 4923 Alpha Way
- 4907 Delta Dr
- 3009 Plainfield Ave
- 3299 E Pierson Rd
- 3364 E Pierson Rd
- 5910 N Dort Hwy
- 6000 N Dort Hwy
- 3456 E Pierson Rd
- 4127 Coggins Ave
- 2935 Richfield Rd
- 3200 N Averill Ave
- 00 Richfield Rd
- 2707 Wilton Place
- 2719 Wilton Place
- 5619 Western Rd
- 5613 Western Rd
- 2723 Wilton Place
- 5701 Western Rd
- 2701 Wilton Place
- 5707 Western Rd
- 2702 Wilton Place
- 2714 Wilton Place
- 2720 Wilton Place
- 2708 Wilton Place
- 5614 Western Rd
- 2801 Wilton Place
- 5719 Western Rd
- 5419 Western Rd
- 2802 Arendal Dr
- 2802 Wilton Place
- 5725 Western Rd
- 5413 Western Rd