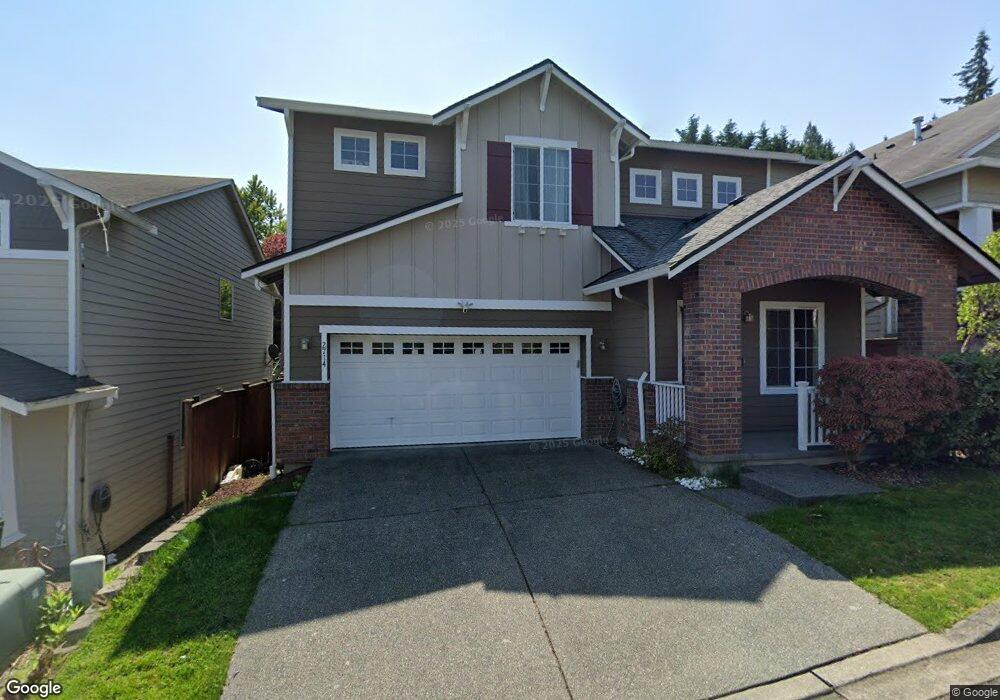
2714 232nd Place SE Unit 28 Bothell, WA 98021
Canyon Creek NeighborhoodEstimated Value: $1,020,000 - $1,221,000
3
Beds
3
Baths
2,513
Sq Ft
$435/Sq Ft
Est. Value
About This Home
This home is located at 2714 232nd Place SE Unit 28, Bothell, WA 98021 and is currently estimated at $1,092,592, approximately $434 per square foot. 2714 232nd Place SE Unit 28 is a home located in Snohomish County with nearby schools including Maywood Hills Elementary School, Canyon Park Junior High School, and Bothell High School.
Ownership History
Date
Name
Owned For
Owner Type
Purchase Details
Closed on
Oct 15, 2009
Sold by
Venugopal Ranganathan
Bought by
Venugopal Ranganathan and Ranganathan Sujatha
Current Estimated Value
Home Financials for this Owner
Home Financials are based on the most recent Mortgage that was taken out on this home.
Original Mortgage
$312,000
Outstanding Balance
$193,526
Interest Rate
4.12%
Mortgage Type
New Conventional
Estimated Equity
$899,066
Purchase Details
Closed on
Aug 9, 2005
Sold by
Centex Homes
Bought by
Venugopal Ranganathan and Ranganathan Sujatha
Home Financials for this Owner
Home Financials are based on the most recent Mortgage that was taken out on this home.
Original Mortgage
$329,177
Interest Rate
5%
Mortgage Type
Fannie Mae Freddie Mac
Create a Home Valuation Report for This Property
The Home Valuation Report is an in-depth analysis detailing your home's value as well as a comparison with similar homes in the area
Home Values in the Area
Average Home Value in this Area
Purchase History
| Date | Buyer | Sale Price | Title Company |
|---|---|---|---|
| Venugopal Ranganathan | $56,179 | Fidelity National Title | |
| Venugopal Ranganathan | $411,472 | Chicago Title |
Source: Public Records
Mortgage History
| Date | Status | Borrower | Loan Amount |
|---|---|---|---|
| Open | Venugopal Ranganathan | $312,000 | |
| Closed | Venugopal Ranganathan | $329,177 |
Source: Public Records
Tax History Compared to Growth
Tax History
| Year | Tax Paid | Tax Assessment Tax Assessment Total Assessment is a certain percentage of the fair market value that is determined by local assessors to be the total taxable value of land and additions on the property. | Land | Improvement |
|---|---|---|---|---|
| 2025 | $7,171 | $902,200 | $557,800 | $344,400 |
| 2024 | $7,171 | $841,200 | $504,400 | $336,800 |
| 2023 | $7,959 | $1,027,800 | $599,500 | $428,300 |
| 2022 | $6,715 | $697,100 | $333,500 | $363,600 |
| 2020 | $6,497 | $625,900 | $313,500 | $312,400 |
| 2019 | $5,865 | $585,000 | $275,500 | $309,500 |
| 2018 | $5,383 | $516,700 | $237,500 | $279,200 |
| 2017 | $4,517 | $436,800 | $175,800 | $261,000 |
| 2016 | $4,410 | $442,100 | $159,600 | $282,500 |
| 2015 | $4,304 | $409,200 | $137,800 | $271,400 |
| 2013 | $3,384 | $290,600 | $104,500 | $186,100 |
Source: Public Records
Map
Nearby Homes
- 23210 27th Ave SE Unit 2
- 23210 27th Ave SE Unit 1
- 23214 27th Ave SE Unit 2
- 23122 35th Ave SE
- 3520 237th St SE Unit 45
- 23426 35th Ave SE
- 23724 35th Dr SE Unit 44
- 23736 35th Dr SE Unit 42
- 3333 228th St SE Unit 69
- 3333 228th St SE Unit 74
- 3333 228th St SE Unit 100
- 23731 35th Dr SE Unit 38
- 3605 231st Place SE
- 3611 232nd St SE
- 3509 237th St SE Unit 27
- 3508 237th St SE Unit 47
- 23127 36th Dr SE
- 23605 35th Dr SE Unit 30
- 23611 35th Dr SE Unit 31
- 1448 238th St SE
- 2710 232nd Place SE Unit 27
- 2718 232nd Place SE Unit 29
- 2706 232nd Place SE
- 2722 232nd Place SE Unit 30
- 2713 232nd Place SE
- 2709 232nd Place SE Unit 38
- 23315 Fitzgerald Rd
- 2702 232nd Place SE Unit 25
- 2726 232nd Place SE Unit 31
- 2730 232nd St SE
- 2715 233rd Place SE
- 23215 27th Dr SE Unit 39
- 2716 232nd St SE Unit 43
- 2720 232nd St SE Unit 44
- 2711 233rd Place SE
- 2804 232nd St SE Unit 32
- 2712 232nd St SE Unit 42
- 23220 27th Dr SE
- 2708 232nd St SE Unit 41
- 2808 232nd St SE