Estimated Value: $257,180 - $282,000
3
Beds
2
Baths
1,787
Sq Ft
$149/Sq Ft
Est. Value
About This Home
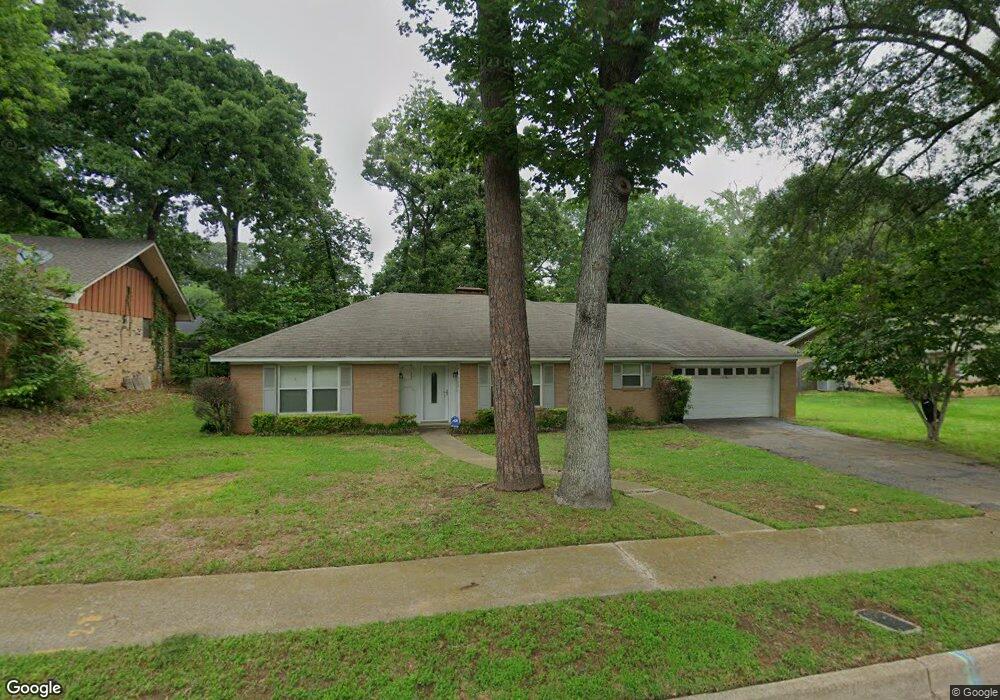
This home is located at 2714 Fairfax Dr, Tyler, TX 75701 and is currently estimated at $265,545, approximately $148 per square foot. 2714 Fairfax Dr is a home located in Smith County with nearby schools including Clarkston Elementary School, Hubbard Middle School, and Tyler Legacy High School.
Ownership History
Date
Name
Owned For
Owner Type
Purchase Details
Closed on
Jul 8, 2013
Sold by
Goodlett Taylor and Goodlett Evelia
Bought by
Lopez Mauro and Lopez Isabel L
Current Estimated Value
Home Financials for this Owner
Home Financials are based on the most recent Mortgage that was taken out on this home.
Original Mortgage
$125,681
Outstanding Balance
$90,130
Interest Rate
3.75%
Mortgage Type
FHA
Estimated Equity
$175,415
Purchase Details
Closed on
Sep 7, 2010
Sold by
Hasting Dodd L and Hasting Carrie
Bought by
Dlj Mortgage Capital Inc
Purchase Details
Closed on
Jul 21, 2006
Sold by
Barksdale Dorothy L
Bought by
Hasting Dodd L and Hasting Carrie
Home Financials for this Owner
Home Financials are based on the most recent Mortgage that was taken out on this home.
Original Mortgage
$104,550
Interest Rate
6.62%
Mortgage Type
New Conventional
Create a Home Valuation Report for This Property
The Home Valuation Report is an in-depth analysis detailing your home's value as well as a comparison with similar homes in the area
Home Values in the Area
Average Home Value in this Area
Purchase History
| Date | Buyer | Sale Price | Title Company |
|---|---|---|---|
| Lopez Mauro | $125,681 | None Available | |
| Dlj Mortgage Capital Inc | $113,664 | None Available | |
| Hasting Dodd L | -- | None Available |
Source: Public Records
Mortgage History
| Date | Status | Borrower | Loan Amount |
|---|---|---|---|
| Open | Lopez Mauro | $125,681 | |
| Previous Owner | Hasting Dodd L | $104,550 |
Source: Public Records
Tax History Compared to Growth
Tax History
| Year | Tax Paid | Tax Assessment Tax Assessment Total Assessment is a certain percentage of the fair market value that is determined by local assessors to be the total taxable value of land and additions on the property. | Land | Improvement |
|---|---|---|---|---|
| 2025 | $2,562 | $252,363 | $40,900 | $211,463 |
| 2024 | $2,562 | $207,411 | $23,326 | $214,113 |
| 2023 | $3,287 | $215,253 | $23,326 | $191,927 |
| 2022 | $3,358 | $185,535 | $23,326 | $162,209 |
| 2021 | $3,269 | $155,831 | $23,326 | $132,505 |
| 2020 | $3,408 | $159,273 | $23,326 | $135,947 |
| 2019 | $3,000 | $137,173 | $11,663 | $125,510 |
| 2018 | $2,836 | $130,413 | $11,663 | $118,750 |
| 2017 | $2,784 | $130,413 | $11,663 | $118,750 |
| 2016 | $2,710 | $126,955 | $11,663 | $115,292 |
| 2015 | $2,548 | $122,273 | $11,663 | $110,610 |
| 2014 | $2,548 | $119,924 | $11,663 | $108,261 |
Source: Public Records
Map
Nearby Homes
- 2827 Fairfax Dr
- 2512 Alta Mira Dr
- 2716 Roanoke Ln
- 2631 Amy Ln
- 2509 Delmar Dr
- 2830 Juniper Ln
- 2902 Shenandoah Dr
- 1920 McDonald Rd
- 2523 Shenandoah Dr
- 2226 Mimosa Dr
- 2716 Royal Village Way
- 3109 Campus Cir
- 2909 Meadowlark Ln
- The Dawson Plan at New Home Living at Medina
- 2949 Medina Dr
- The Hubbard Plan at New Home Living at Medina
- 3108 Williamsburg Cir
- 3801 Old Troup Hwy
- 2026 Neeley St
- 3020 Meadowlark Ln
- 2714 2714 Fairfax Dr
- 2710 Fairfax Dr
- 2710 2710 Fairfax Dr
- 2720 Fairfax Dr
- 2829 Yorktown Dr
- 2829 2829 Yorktown Dr
- 2829 Yorktown St
- 2824 2824 Yorktown Dr
- 2700 Fairfax Dr
- 2715 2715 Fairfax Dr
- 2824 Yorktown St
- 2709 Fairfax Dr
- 2721 Fairfax Dr
- 2823 Yorktown St
- 2701 2701 Fairfax
- 2726 Fairfax Dr
- 2701 Fairfax Dr
- 2804 Alexandria Place
- 2727 Fairfax Dr
- 2714 Rockbridge Rd