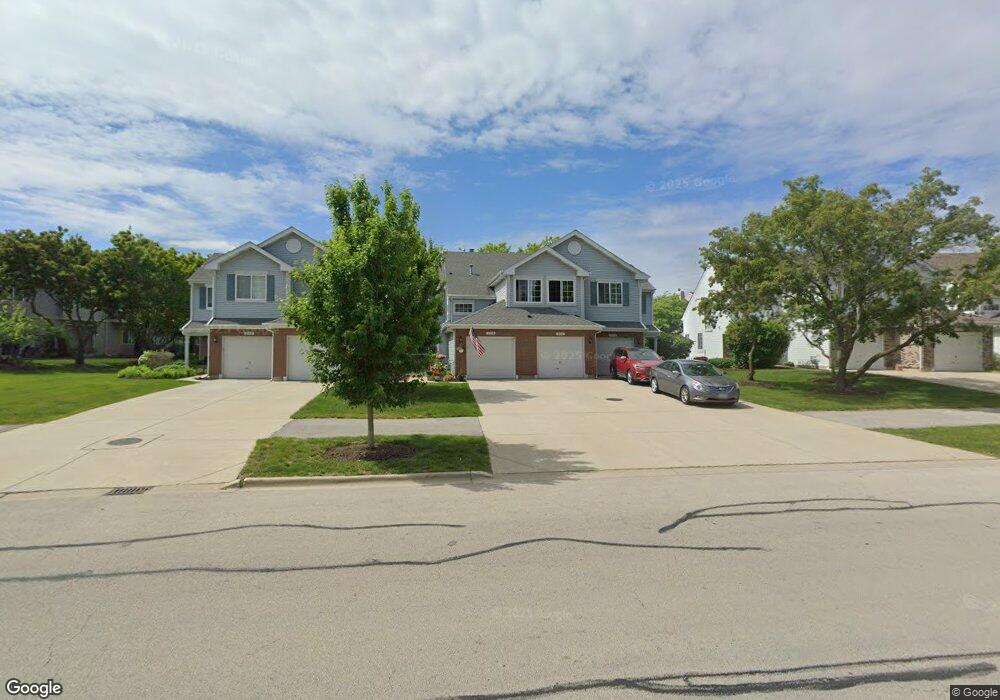
2714 Holmes Way Unit 202714 Schaumburg, IL 60194
West Schaumburg NeighborhoodEstimated Value: $284,817 - $332,000
2
Beds
--
Bath
1,100
Sq Ft
$280/Sq Ft
Est. Value
About This Home
This home is located at 2714 Holmes Way Unit 202714, Schaumburg, IL 60194 and is currently estimated at $308,204, approximately $280 per square foot. 2714 Holmes Way Unit 202714 is a home located in Cook County with nearby schools including Glenbrook Elementary School, Canton Middle School, and Streamwood High School.
Ownership History
Date
Name
Owned For
Owner Type
Purchase Details
Closed on
Jul 10, 2024
Sold by
Herbst Phil and Herbst Phillip A
Bought by
Herbst/Medley Family Trust and Herbst
Current Estimated Value
Purchase Details
Closed on
Mar 30, 2005
Sold by
Cavalier Anthony J and Cavalier Laura E
Bought by
Herbst Phil and Medley Charlene
Home Financials for this Owner
Home Financials are based on the most recent Mortgage that was taken out on this home.
Original Mortgage
$198,900
Interest Rate
6.06%
Mortgage Type
New Conventional
Purchase Details
Closed on
Oct 18, 1995
Sold by
Pinnacle Corp
Bought by
Cavalier Anthony J and Stokes Laura E
Home Financials for this Owner
Home Financials are based on the most recent Mortgage that was taken out on this home.
Original Mortgage
$129,500
Interest Rate
7.68%
Mortgage Type
FHA
Create a Home Valuation Report for This Property
The Home Valuation Report is an in-depth analysis detailing your home's value as well as a comparison with similar homes in the area
Home Values in the Area
Average Home Value in this Area
Purchase History
| Date | Buyer | Sale Price | Title Company |
|---|---|---|---|
| Herbst/Medley Family Trust | -- | None Listed On Document | |
| Herbst Phil | $221,000 | Atgf Inc | |
| Cavalier Anthony J | $136,000 | -- |
Source: Public Records
Mortgage History
| Date | Status | Borrower | Loan Amount |
|---|---|---|---|
| Previous Owner | Herbst Phil | $198,900 | |
| Previous Owner | Cavalier Anthony J | $129,500 |
Source: Public Records
Tax History Compared to Growth
Tax History
| Year | Tax Paid | Tax Assessment Tax Assessment Total Assessment is a certain percentage of the fair market value that is determined by local assessors to be the total taxable value of land and additions on the property. | Land | Improvement |
|---|---|---|---|---|
| 2024 | $4,779 | $20,288 | $2,691 | $17,597 |
| 2023 | $4,642 | $20,288 | $2,691 | $17,597 |
| 2022 | $4,642 | $20,288 | $2,691 | $17,597 |
| 2021 | $4,314 | $16,444 | $3,279 | $13,165 |
| 2020 | $4,337 | $16,444 | $3,279 | $13,165 |
| 2019 | $4,371 | $18,439 | $3,279 | $15,160 |
| 2018 | $4,121 | $16,235 | $2,858 | $13,377 |
| 2017 | $4,107 | $16,235 | $2,858 | $13,377 |
| 2016 | $4,114 | $16,235 | $2,858 | $13,377 |
| 2015 | $4,545 | $16,503 | $2,522 | $13,981 |
| 2014 | $4,507 | $16,503 | $2,522 | $13,981 |
| 2013 | $4,357 | $16,503 | $2,522 | $13,981 |
Source: Public Records
Map
Nearby Homes
- 239 Camel Bend Ct Unit 36239
- 247 Camel Bend Ct Unit 37247
- 217 Sierra Pass Dr Unit 28217
- 2741 Odlum Dr Unit 3
- 171 Sierra Pass Dr Unit 261713
- 226 Sierra Pass Dr Unit 62262
- 368 Glen Byrn Ct Unit 11368A
- 205 Glasgow Ln Unit V1
- 2868 Belle Ln Unit 143B28
- 2933 Heatherwood Dr Unit 1915
- 198 Camden Ct Unit Z2
- 62 Beechmont Ct Unit C
- 2 Oakmont Ct
- 195 Island Ct
- 2902 Belle Ln
- 209 Westminster Ct Unit C
- 216 Winnsboro Ct Unit A
- 216 Whitewood Dr Unit 5
- 224 Winnsboro Ct Unit A
- 133 White Branch Ct S Unit 539
- 2702 Holmes Way Unit 192702
- 2700 Holmes Way Unit 192700
- 2703 Odlum Dr Unit 182703
- 2703 Odlum Dr Unit 1827031
- 2703 Odlum Dr Unit 1
- 2706 Holmes Way Unit 192706
- 2705 Odlum Dr Unit 182705
- 2705 Odlum Dr Unit 4
- 2705 Odlum Dr Unit 2705
- 2708 Holmes Way Unit 3
- 2708 Holmes Way Unit 192708
- 2701 Odlum Dr Unit 182701
- 2707 Odlum Dr Unit 182707
- 2704 Holmes Way Unit 192704
- 2709 Odlum Dr Unit 182709
- 2709 Odlum Dr Unit 1
- 2711 Odlum Dr Unit 182711
- 2711 Odlum Dr Unit 3
- 2712 Holmes Way Unit 202712
- 2712 Holmes Way Unit 1