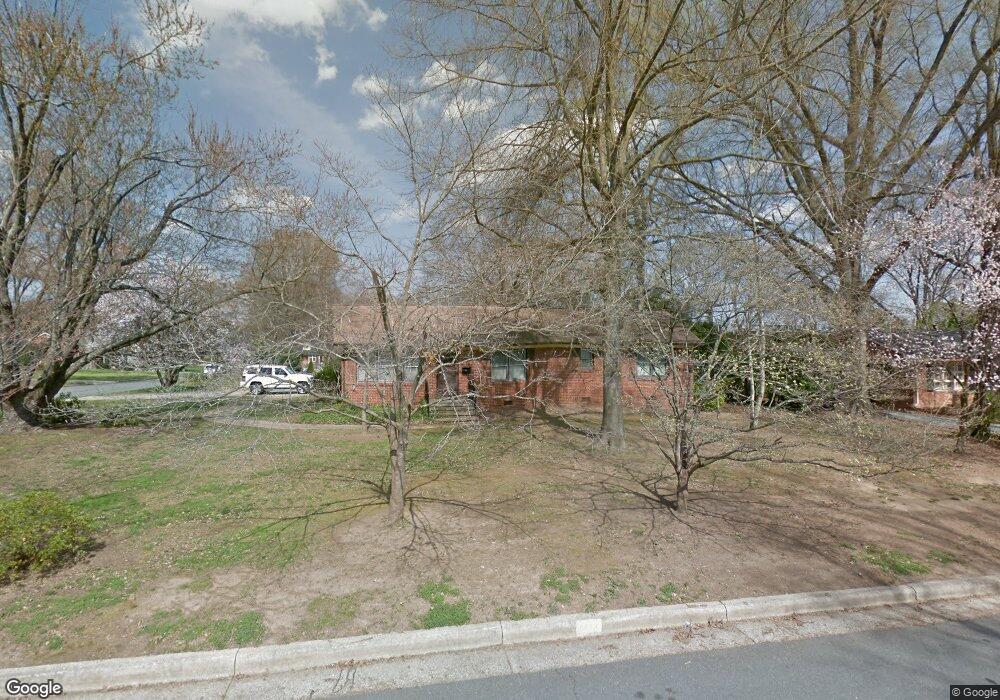
2715 Amherst Ave Burlington, NC 27215
West Burlington NeighborhoodEstimated Value: $250,000 - $306,000
3
Beds
2
Baths
1,430
Sq Ft
$192/Sq Ft
Est. Value
About This Home
This home is located at 2715 Amherst Ave, Burlington, NC 27215 and is currently estimated at $275,049, approximately $192 per square foot. 2715 Amherst Ave is a home located in Alamance County with nearby schools including Marvin B. Smith Elementary School, Turrentine Middle School, and Walter M. Williams High School.
Ownership History
Date
Name
Owned For
Owner Type
Purchase Details
Closed on
Jul 15, 2022
Sold by
Wade Overman Travis and Wade Marie Abby
Bought by
Andrews Donald W and Andrews Sara W
Current Estimated Value
Home Financials for this Owner
Home Financials are based on the most recent Mortgage that was taken out on this home.
Original Mortgage
$215,000
Outstanding Balance
$204,794
Interest Rate
5.23%
Mortgage Type
New Conventional
Estimated Equity
$70,255
Purchase Details
Closed on
May 20, 2021
Sold by
Vondy Jeffrey Dean and Demby Mary Lela
Bought by
Overman Travis Wade and Moser Abby Marie
Home Financials for this Owner
Home Financials are based on the most recent Mortgage that was taken out on this home.
Original Mortgage
$118,000
Interest Rate
2.9%
Mortgage Type
New Conventional
Purchase Details
Closed on
Jul 27, 2006
Sold by
Mcdonald Daniel G
Bought by
Vondy Jeffrey Dean
Create a Home Valuation Report for This Property
The Home Valuation Report is an in-depth analysis detailing your home's value as well as a comparison with similar homes in the area
Home Values in the Area
Average Home Value in this Area
Purchase History
| Date | Buyer | Sale Price | Title Company |
|---|---|---|---|
| Andrews Donald W | $158,000 | Oertel Paul L | |
| Overman Travis Wade | $147,500 | None Available | |
| Vondy Jeffrey Dean | $141,000 | -- |
Source: Public Records
Mortgage History
| Date | Status | Borrower | Loan Amount |
|---|---|---|---|
| Open | Andrews Donald W | $215,000 | |
| Previous Owner | Overman Travis Wade | $118,000 |
Source: Public Records
Tax History Compared to Growth
Tax History
| Year | Tax Paid | Tax Assessment Tax Assessment Total Assessment is a certain percentage of the fair market value that is determined by local assessors to be the total taxable value of land and additions on the property. | Land | Improvement |
|---|---|---|---|---|
| 2025 | $1,419 | $287,266 | $50,000 | $237,266 |
| 2024 | $1,347 | $287,266 | $50,000 | $237,266 |
| 2023 | $2,617 | $287,266 | $50,000 | $237,266 |
| 2022 | $1,793 | $144,491 | $40,000 | $104,491 |
| 2021 | $859 | $144,491 | $40,000 | $104,491 |
| 2020 | $1,822 | $144,491 | $40,000 | $104,491 |
| 2019 | $968 | $144,491 | $40,000 | $104,491 |
| 2018 | $0 | $144,491 | $40,000 | $104,491 |
| 2017 | $1,701 | $144,491 | $40,000 | $104,491 |
| 2016 | $1,519 | $130,924 | $40,000 | $90,924 |
| 2015 | $756 | $130,924 | $40,000 | $90,924 |
| 2014 | $690 | $130,924 | $40,000 | $90,924 |
Source: Public Records
Map
Nearby Homes
- 2616 Amherst Ct
- 2511 Hickory Ave
- 818 Colonial Dr
- 2804 Edgewood Ave
- 2825 Bedford St
- 2941 Amherst Ave
- 2323 Pineview Dr
- 3475 Forestdale Dr Unit 2a
- 2528 Pineway Dr
- 2223 Delaney Dr Unit 214
- 2219 Delaney Dr Unit 314
- 2221 #314 Delaney Dr
- 3489 Forestdale Dr Unit 2d
- 3489 Forestdale Dr Unit 1C
- 000 Cardwell Dr
- 3232 Hiddenwood Ln
- 204 N Gurney St
- 538 N Gurney St
- 2421 Saddle Club Rd
- 2725 Amherst Ave
- 2612 Amherst Ct
- 2716 Amherst Ave
- 2441 Hickory Ave
- 2712 Amherst Ave
- 2615 Amherst Ct
- 2437 Hickory Ave
- 2708 Amherst Ave
- 2435 Hickory Ave
- 2724 Amherst Ave
- 2607 Amherst Ct
- 2608 Amherst Ct
- 2602 Edgewood Ave
- 2505 Hickory Ave
- 2719 Dee St
- 2715 Dee St
- 2704 Edgewood Ave
- 2723 Dee St
- 2604 Amherst Ct
- 2433 Hickory Ave