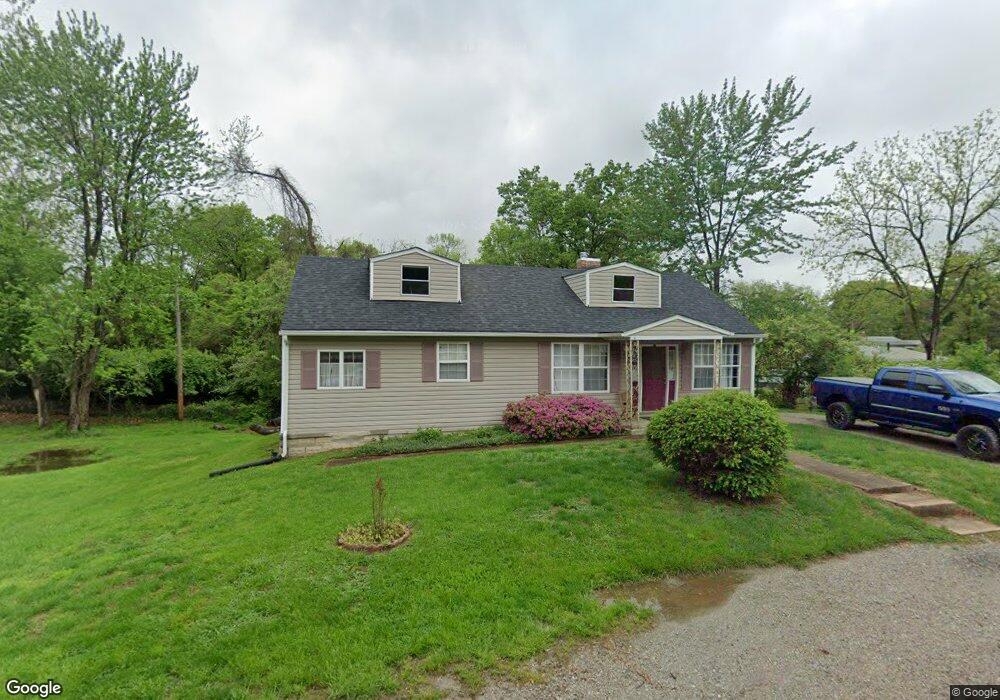
2715 Bellecote Ave Saint Louis, MO 63114
Estimated Value: $128,000 - $184,000
3
Beds
1
Bath
1,233
Sq Ft
$131/Sq Ft
Est. Value
About This Home
This home is located at 2715 Bellecote Ave, Saint Louis, MO 63114 and is currently estimated at $161,446, approximately $130 per square foot. 2715 Bellecote Ave is a home located in St. Louis County with nearby schools including Robert Drummond Elementary School, Holman Middle School, and Pattonville High School.
Ownership History
Date
Name
Owned For
Owner Type
Purchase Details
Closed on
Mar 30, 2022
Sold by
Battee Tracy L
Bought by
Music Johnny R
Current Estimated Value
Home Financials for this Owner
Home Financials are based on the most recent Mortgage that was taken out on this home.
Original Mortgage
$94,751
Outstanding Balance
$88,528
Interest Rate
3.92%
Mortgage Type
FHA
Estimated Equity
$72,918
Purchase Details
Closed on
Dec 29, 2007
Sold by
Battee Richard
Bought by
Battee Tracy
Purchase Details
Closed on
Mar 11, 2005
Sold by
Thomas Michael A and Thomas Margaret
Bought by
Battee Richard and Battee Tracey L
Home Financials for this Owner
Home Financials are based on the most recent Mortgage that was taken out on this home.
Original Mortgage
$95,200
Interest Rate
7.1%
Mortgage Type
Fannie Mae Freddie Mac
Purchase Details
Closed on
Mar 3, 1997
Sold by
Blackwell Robert J
Bought by
Thomas Michael and Thomas Margaret
Create a Home Valuation Report for This Property
The Home Valuation Report is an in-depth analysis detailing your home's value as well as a comparison with similar homes in the area
Home Values in the Area
Average Home Value in this Area
Purchase History
| Date | Buyer | Sale Price | Title Company |
|---|---|---|---|
| Music Johnny R | -- | None Listed On Document | |
| Battee Tracy | -- | None Available | |
| Battee Richard | $106,000 | -- | |
| Thomas Michael | -- | -- |
Source: Public Records
Mortgage History
| Date | Status | Borrower | Loan Amount |
|---|---|---|---|
| Open | Music Johnny R | $94,751 | |
| Previous Owner | Battee Richard | $95,200 | |
| Closed | Battee Richard | $23,800 |
Source: Public Records
Tax History Compared to Growth
Tax History
| Year | Tax Paid | Tax Assessment Tax Assessment Total Assessment is a certain percentage of the fair market value that is determined by local assessors to be the total taxable value of land and additions on the property. | Land | Improvement |
|---|---|---|---|---|
| 2025 | $2,098 | $31,920 | $8,930 | $22,990 |
| 2024 | $2,098 | $27,200 | $6,950 | $20,250 |
| 2023 | $2,098 | $27,200 | $6,950 | $20,250 |
| 2022 | $1,792 | $20,900 | $5,170 | $15,730 |
| 2021 | $1,785 | $20,900 | $5,170 | $15,730 |
| 2020 | $1,639 | $18,410 | $5,190 | $13,220 |
| 2019 | $1,631 | $18,410 | $5,190 | $13,220 |
| 2018 | $1,858 | $19,060 | $3,690 | $15,370 |
| 2017 | $1,858 | $19,060 | $3,690 | $15,370 |
| 2016 | $1,612 | $16,440 | $5,190 | $11,250 |
| 2015 | $1,594 | $16,440 | $5,190 | $11,250 |
| 2014 | $1,654 | $16,990 | $3,080 | $13,910 |
Source: Public Records
Map
Nearby Homes
- 10719 Thorpe Ave
- 10651 Thorpe Ave
- 10643 Thorpe Ave
- 10730 Wurdack Ave
- 2454 Prouhet Ave
- 2703 Ashby Rd
- 2430 Prouhet Ave
- 10627 Canter Way
- 2450 Fowler Ave
- 2729 Link Rd
- 2412 Silkwood Dr
- 10515 Clarendon Ave
- 3001 Ashby Rd
- 3005 Ashby Rd
- 3000 Ashby Rd
- 10490 Canter Way
- 10726 Niblic Dr
- 10235 Midland Blvd
- 2300 Ruckert Ave
- 2255 N Warson Rd
- 10655 Ridge Ave
- 10718 Thorpe Ave
- 10727 Ridge Ave
- 2710 Bellecote Ave
- 10720 Thorpe Ave
- 10651 Ridge Ave
- 10724 Thorpe Ave
- 10652 Thorpe Ave
- 10726 Ridge Ave
- 10650 Ridge Ave
- 2628 White Manor Ct
- 10728 Thorpe Ave
- 10637 Ridge Ave
- 10713 Thorpe Ave
- 10648 Thorpe Ave
- 10715 Thorpe Ave
- 10657 Thorpe Ave
- 2636 White Manor Ct
- 2620 White Manor Ct
- 10638 Ridge Ave