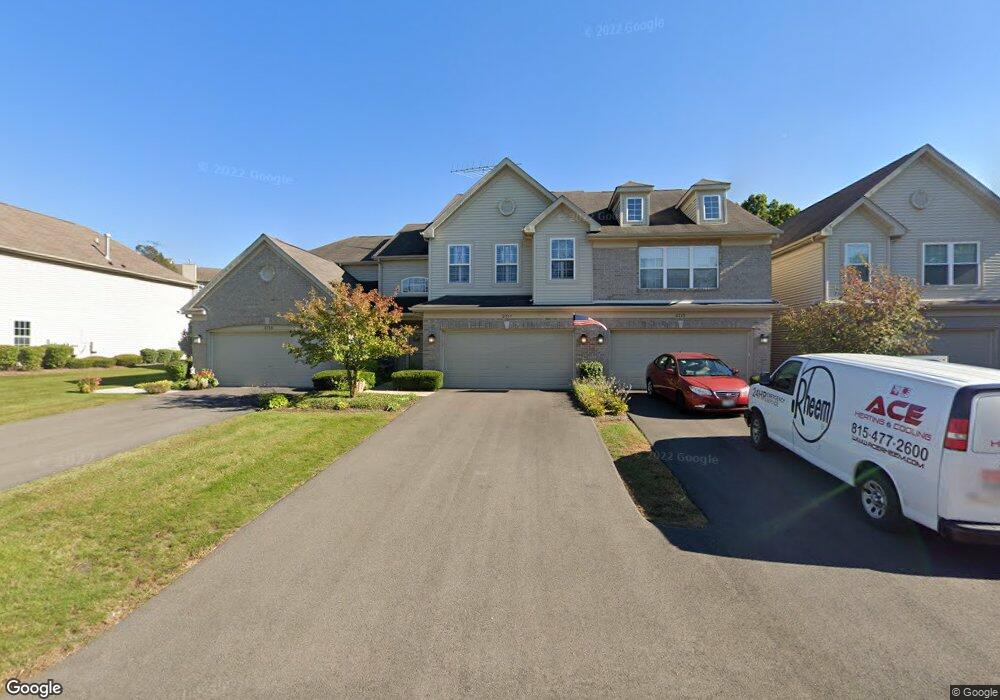
2715 Cobblestone Dr Unit 2715 Crystal Lake, IL 60012
Estimated Value: $256,000 - $269,000
2
Beds
2
Baths
1,289
Sq Ft
$204/Sq Ft
Est. Value
About This Home
This home is located at 2715 Cobblestone Dr Unit 2715, Crystal Lake, IL 60012 and is currently estimated at $262,650, approximately $203 per square foot. 2715 Cobblestone Dr Unit 2715 is a home located in McHenry County with nearby schools including North Elementary School, Hannah Beardsley Middle School, and Prairie Ridge High School.
Ownership History
Date
Name
Owned For
Owner Type
Purchase Details
Closed on
Sep 14, 2017
Sold by
Ronaghi Parinaz
Bought by
Ronaghi Parinaz and Ronaghi Nadereh
Current Estimated Value
Purchase Details
Closed on
Jun 8, 2017
Sold by
Barber Amy P and Barber David R
Bought by
Ronaghi Parinaz
Home Financials for this Owner
Home Financials are based on the most recent Mortgage that was taken out on this home.
Original Mortgage
$137,464
Outstanding Balance
$115,054
Interest Rate
4.25%
Mortgage Type
FHA
Estimated Equity
$147,596
Purchase Details
Closed on
Aug 18, 2014
Sold by
Barber David R and Barber Amy P
Bought by
Barber David R and Tena Amy P Barber Joint
Purchase Details
Closed on
Apr 29, 2002
Sold by
Cobblestone Woods Townhouses Llc
Bought by
Schwilk Robert and Schwilk Norma
Create a Home Valuation Report for This Property
The Home Valuation Report is an in-depth analysis detailing your home's value as well as a comparison with similar homes in the area
Home Values in the Area
Average Home Value in this Area
Purchase History
| Date | Buyer | Sale Price | Title Company |
|---|---|---|---|
| Ronaghi Parinaz | -- | None Available | |
| Ronaghi Parinaz | $140,000 | Heritage Title Co | |
| Barber David R | -- | None Available | |
| Schwilk Robert | $149,207 | Chicago Title Insurance Co |
Source: Public Records
Mortgage History
| Date | Status | Borrower | Loan Amount |
|---|---|---|---|
| Open | Ronaghi Parinaz | $137,464 |
Source: Public Records
Tax History Compared to Growth
Tax History
| Year | Tax Paid | Tax Assessment Tax Assessment Total Assessment is a certain percentage of the fair market value that is determined by local assessors to be the total taxable value of land and additions on the property. | Land | Improvement |
|---|---|---|---|---|
| 2024 | $4,679 | $68,821 | $8,483 | $60,338 |
| 2023 | $4,502 | $61,717 | $7,607 | $54,110 |
| 2022 | $4,104 | $53,660 | $6,614 | $47,046 |
| 2021 | $3,890 | $50,309 | $6,201 | $44,108 |
| 2020 | $3,826 | $48,801 | $6,015 | $42,786 |
| 2019 | $3,678 | $46,398 | $5,719 | $40,679 |
| 2018 | $3,650 | $45,417 | $5,372 | $40,045 |
| 2017 | $4,257 | $43,512 | $5,147 | $38,365 |
| 2016 | $4,248 | $41,515 | $4,911 | $36,604 |
| 2013 | -- | $36,077 | $4,674 | $31,403 |
Source: Public Records
Map
Nearby Homes
- 2623 Cobblestone Dr
- 2871 Granite Ct
- 2916 Skyline Dr
- 6107 Coachlight Rd
- 2002 S Illinois Route 31
- 3319 Lakewood Dr
- 3401 Thunderbird Ln
- 3415 Thunderbird Ln
- 6605 Oakwood Manor Dr
- 3738 Thunderbird Ln
- 3736 Thunderbird Ln
- 3734 Thunderbird Ln
- 1510 S Illinois Route 31
- 4221 Savoy Ln Unit 28C721
- 2215 Concord Dr Unit 2215
- 2237 Concord Dr Unit 30D720
- 1100 S Illinois Route 31
- 2267 Concord Dr Unit 2267
- 0 State Route 31
- 3513 Deep Wood Dr
- 2721 Cobblestone Dr
- 2715 Cobblestone Dr
- 2719 Cobblestone Dr
- 2721 Cobblestone Dr Unit END
- 2717 Cobblestone Dr
- 2717 Cobblestone Dr Unit B
- 2725 Cobblestone Dr
- 2727 Cobblestone Dr
- 2729 Cobblestone Dr
- 2731 Cobblestone Dr
- 2727 Cobblestone Dr Unit B
- 2705 Cobblestone Dr
- 2707 Cobblestone Dr
- 2701 Cobblestone Dr
- 2707 Cobblestone Dr Unit END
- 2705 Cobblestone Dr Unit 2705
- 2703 Cobblestone Dr
- 2706 Granite Ct
- 2708 Granite Ct
- 2724 Granite Ct