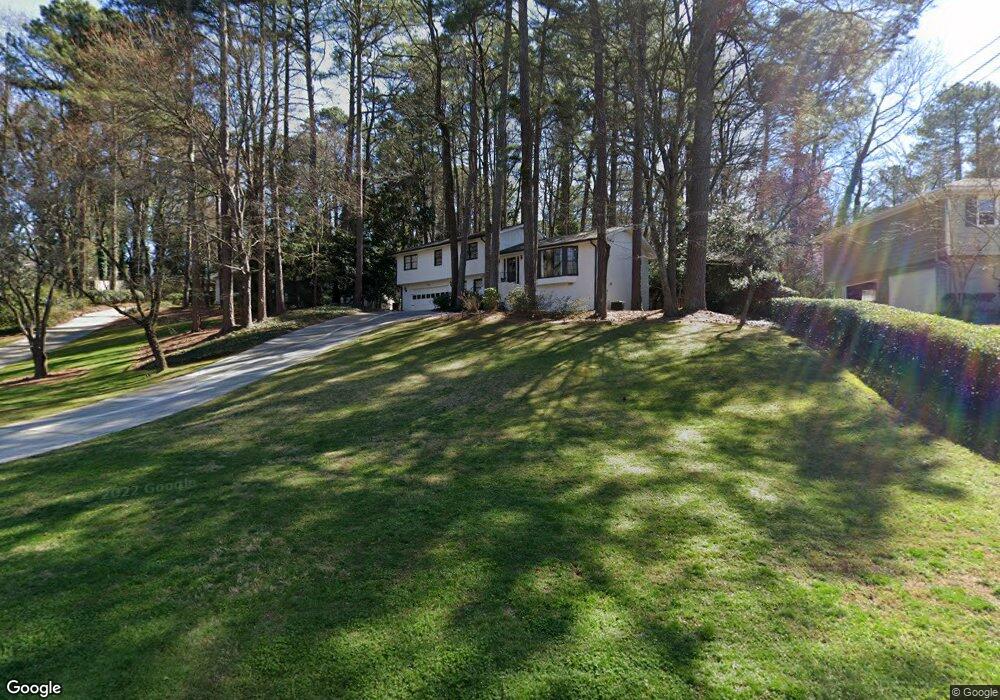
2715 E Sudbury Ct Unit 18 Atlanta, GA 30360
Estimated Value: $505,000 - $625,000
4
Beds
3
Baths
2,127
Sq Ft
$265/Sq Ft
Est. Value
About This Home
This home is located at 2715 E Sudbury Ct Unit 18, Atlanta, GA 30360 and is currently estimated at $563,960, approximately $265 per square foot. 2715 E Sudbury Ct Unit 18 is a home located in DeKalb County with nearby schools including Chesnut Elementary School, Peachtree Middle School, and Dunwoody High School.
Ownership History
Date
Name
Owned For
Owner Type
Purchase Details
Closed on
Nov 30, 2011
Sold by
Macleod-Orrell Sara
Bought by
Orrell Sara M
Current Estimated Value
Home Financials for this Owner
Home Financials are based on the most recent Mortgage that was taken out on this home.
Original Mortgage
$266,975
Outstanding Balance
$181,485
Interest Rate
3.88%
Mortgage Type
New Conventional
Estimated Equity
$382,475
Purchase Details
Closed on
Apr 11, 2008
Sold by
Macleod-Orrell Sra
Bought by
Orrell Ronald B
Home Financials for this Owner
Home Financials are based on the most recent Mortgage that was taken out on this home.
Original Mortgage
$264,000
Interest Rate
5%
Mortgage Type
FHA
Purchase Details
Closed on
May 30, 2003
Sold by
Davis Donald L
Bought by
Macleod Sara
Home Financials for this Owner
Home Financials are based on the most recent Mortgage that was taken out on this home.
Original Mortgage
$210,400
Interest Rate
3.25%
Mortgage Type
New Conventional
Create a Home Valuation Report for This Property
The Home Valuation Report is an in-depth analysis detailing your home's value as well as a comparison with similar homes in the area
Home Values in the Area
Average Home Value in this Area
Purchase History
| Date | Buyer | Sale Price | Title Company |
|---|---|---|---|
| Orrell Sara M | -- | -- | |
| Orrell Ronald B | -- | -- | |
| Macleod Sara | $263,000 | -- |
Source: Public Records
Mortgage History
| Date | Status | Borrower | Loan Amount |
|---|---|---|---|
| Open | Orrell Sara M | $266,975 | |
| Previous Owner | Orrell Ronald B | $264,000 | |
| Previous Owner | Macleod Sara | $210,400 |
Source: Public Records
Tax History Compared to Growth
Tax History
| Year | Tax Paid | Tax Assessment Tax Assessment Total Assessment is a certain percentage of the fair market value that is determined by local assessors to be the total taxable value of land and additions on the property. | Land | Improvement |
|---|---|---|---|---|
| 2024 | $4,749 | $178,360 | $59,200 | $119,160 |
| 2023 | $4,749 | $178,320 | $59,200 | $119,120 |
| 2022 | $4,299 | $159,120 | $59,200 | $99,920 |
| 2021 | $3,782 | $138,880 | $59,200 | $79,680 |
| 2020 | $3,762 | $134,960 | $59,200 | $75,760 |
| 2019 | $3,032 | $105,680 | $59,200 | $46,480 |
| 2018 | $3,412 | $102,400 | $59,200 | $43,200 |
| 2017 | $3,713 | $118,240 | $59,200 | $59,040 |
| 2016 | $3,594 | $117,240 | $59,200 | $58,040 |
| 2014 | $2,992 | $92,120 | $59,200 | $32,920 |
Source: Public Records
Map
Nearby Homes
- 2659 Amberly Dr Unit 18
- 4579 Amberly Ct S
- 2631 Holliston Ct
- 2600 Amberly Dr
- 2611 Briers Dr N
- 4610 Brierwood Place
- 4400 Hickory Wood Ln
- 2597 E Madison Dr
- 2624 E Madison Dr
- 2551 Briers North Dr
- 4430 Tilly Mill Rd Unit 104
- 4430 Tilly Mill Rd Unit 201
- 4430 Tilly Mill Rd Unit 818
- 4430 Tilly Mill Rd Unit 1304
- 2459 Chestnut Landing
- 2484 Madison Commons
- 2597 Adventure Way
- 2591 Adventure Way
- 2709 E Sudbury Ct
- 2721 E Sudbury Ct Unit 18
- E E Sudbury Ct
- 2729 E Sudbury Ct
- 2729 E Sudbury Ct
- 2729 E Sudbury Ct Unit 2729
- 4497 Sudbury Rd
- 2708 Claridge Ct
- 2716 Claridge Ct
- 4503 Sudbury Rd
- 2700 Claridge Ct
- 2718 E Sudbury Ct
- 2710 E Sudbury Ct
- 4513 Sudbury Rd
- 2730 E Sudbury Ct
- 2724 Claridge Ct
- 0 Claridge Ct Unit 7086238
- 0 Claridge Ct Unit 3282854
- 0 Claridge Ct Unit 3254397
- 0 Claridge Ct Unit 8259812