Estimated Value: $330,216 - $509,000
--
Bed
--
Bath
2,112
Sq Ft
$193/Sq Ft
Est. Value
About This Home
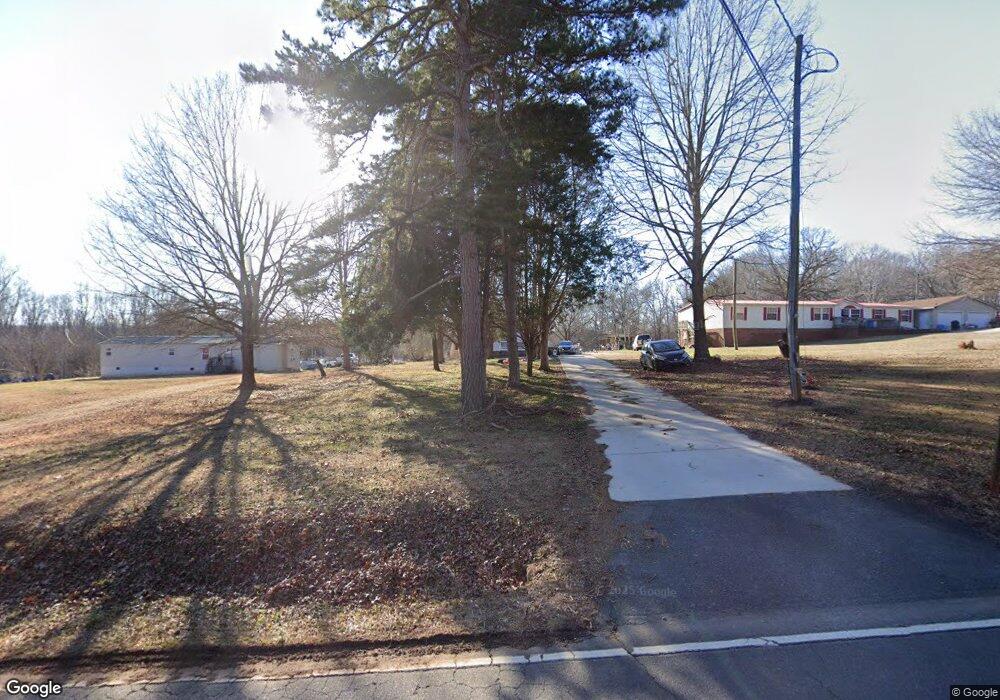
This home is located at 2715 Jim McCarter Rd, York, SC 29745 and is currently estimated at $407,304, approximately $192 per square foot. 2715 Jim McCarter Rd is a home located in York County with nearby schools including Larne Elementary School, Clover Middle School, and Clover High School.
Ownership History
Date
Name
Owned For
Owner Type
Purchase Details
Closed on
Aug 22, 2022
Sold by
Miller Jami M
Bought by
Threatt Keri Robin and Miller Jami Marie
Current Estimated Value
Home Financials for this Owner
Home Financials are based on the most recent Mortgage that was taken out on this home.
Original Mortgage
$239,075
Outstanding Balance
$228,258
Interest Rate
5.51%
Mortgage Type
New Conventional
Estimated Equity
$179,046
Purchase Details
Closed on
Dec 11, 2021
Sold by
Miller Christina M
Bought by
Miller Jami M
Purchase Details
Closed on
Sep 29, 2021
Sold by
Miller Christina M
Bought by
Miller Jami M
Purchase Details
Closed on
Oct 23, 2003
Sold by
Adnah Hills Inc
Bought by
Miller Christina M
Purchase Details
Closed on
Sep 15, 2003
Sold by
Irwin Union Bank & Trust Co
Bought by
Hopper William D
Purchase Details
Closed on
Aug 11, 2003
Sold by
Acuff Fred H
Bought by
Irwin Union Bank & Trust Co
Create a Home Valuation Report for This Property
The Home Valuation Report is an in-depth analysis detailing your home's value as well as a comparison with similar homes in the area
Home Values in the Area
Average Home Value in this Area
Purchase History
| Date | Buyer | Sale Price | Title Company |
|---|---|---|---|
| Threatt Keri Robin | -- | None Listed On Document | |
| Miller Jami M | -- | None Available | |
| Miller Jami M | -- | None Available | |
| Miller Christina M | $105,000 | -- | |
| Hopper William D | $40,000 | -- | |
| Irwin Union Bank & Trust Co | $45,000 | -- |
Source: Public Records
Mortgage History
| Date | Status | Borrower | Loan Amount |
|---|---|---|---|
| Open | Threatt Keri Robin | $239,075 |
Source: Public Records
Tax History Compared to Growth
Tax History
| Year | Tax Paid | Tax Assessment Tax Assessment Total Assessment is a certain percentage of the fair market value that is determined by local assessors to be the total taxable value of land and additions on the property. | Land | Improvement |
|---|---|---|---|---|
| 2025 | $1,190 | $9,476 | $1,520 | $7,956 |
| 2024 | $1,206 | $9,315 | $1,360 | $7,955 |
| 2023 | $1,240 | $9,315 | $1,360 | $7,955 |
| 2022 | $214 | $1,989 | $1,360 | $629 |
| 2021 | $0 | $2,588 | $1,770 | $818 |
| 2020 | $854 | $2,588 | $0 | $0 |
| 2019 | $783 | $2,250 | $0 | $0 |
| 2018 | $774 | $2,250 | $0 | $0 |
| 2017 | $741 | $2,250 | $0 | $0 |
| 2016 | $723 | $2,250 | $0 | $0 |
| 2014 | $673 | $2,250 | $1,080 | $1,170 |
| 2013 | $673 | $2,250 | $1,080 | $1,170 |
Source: Public Records
Map
Nearby Homes
- 1990 State Road S-46-1290
- 2060 Berrywood Ln
- 1804 Tom Joye Rd
- 0.53 Jim McCarter Rd
- 100 Stafford Dr
- 151 Stafford Dr
- 1637 Jim McCarter Rd N
- 903 Little Brook Cir
- 637 Cassidy Ct
- 641 Cassidy Ct
- 327 Laura Elizabeth Ln
- 645 Cassidy Ct
- 323 Laura Elizabeth Ln
- 316 Laura Elizabeth Ln
- 315 Laura Elizabeth Ln
- 319 Laura Elizabeth Ln
- 331 Laura Elizabeth Ln
- 311 Laura Elizabeth Ln
- 197 Ormand Rd
- 8045 Smooth Stone Ct
- 3108 McCarter Ln
- 2725 Jim McCarter Rd
- 2753 Jim McCarter Rd S
- 3130 McCarter Ln
- 2710 Jim McCarter Rd S
- 2722 Jim McCarter Rd S
- 2734 Jim McCarter Rd S
- 3121 McCarter Ln
- 3140 McCarter Ln
- 2654 Jim McCarter Rd S
- 2671 Jim McCarter Rd
- 2785 Jim McCarter Rd
- 2774 Jim McCarter Rd
- 2664 Jim McCarter Rd
- 2664 Jim McCarter Rd
- 2776 Jim McCarter Rd
- 2793 Jim McCarter Rd S
- 2656 Jim McCarter Rd S
- 2692 Jim McCarter Rd S
- 2802 Jim McCarter Rd S Unit 9