2715 Mulligan Ln Belleville, IL 62220
Estimated Value: $200,000 - $357,864
--
Bed
--
Bath
1,024
Sq Ft
$272/Sq Ft
Est. Value
About This Home
This home is located at 2715 Mulligan Ln, Belleville, IL 62220 and is currently estimated at $278,932, approximately $272 per square foot. 2715 Mulligan Ln is a home located in St. Clair County with nearby schools including Westhaven Elementary School, Central Jr High School, and Notre Dame Academy of Belleville.
Create a Home Valuation Report for This Property
The Home Valuation Report is an in-depth analysis detailing your home's value as well as a comparison with similar homes in the area
Home Values in the Area
Average Home Value in this Area
Tax History Compared to Growth
Tax History
| Year | Tax Paid | Tax Assessment Tax Assessment Total Assessment is a certain percentage of the fair market value that is determined by local assessors to be the total taxable value of land and additions on the property. | Land | Improvement |
|---|---|---|---|---|
| 2024 | $6,771 | $99,322 | $9,650 | $89,672 |
| 2023 | $6,656 | $92,570 | $8,898 | $83,672 |
| 2022 | $6,261 | $85,283 | $8,112 | $77,171 |
| 2021 | $6,059 | $80,493 | $7,558 | $72,935 |
| 2020 | $6,361 | $80,192 | $7,269 | $72,923 |
| 2019 | $6,124 | $80,061 | $7,138 | $72,923 |
| 2018 | $5,975 | $77,166 | $6,797 | $70,369 |
| 2017 | $6,025 | $73,514 | $6,406 | $67,108 |
| 2016 | $6,304 | $76,239 | $6,406 | $69,833 |
| 2014 | $5,426 | $74,901 | $6,181 | $68,720 |
| 2013 | $5,570 | $76,491 | $6,275 | $70,216 |
Source: Public Records
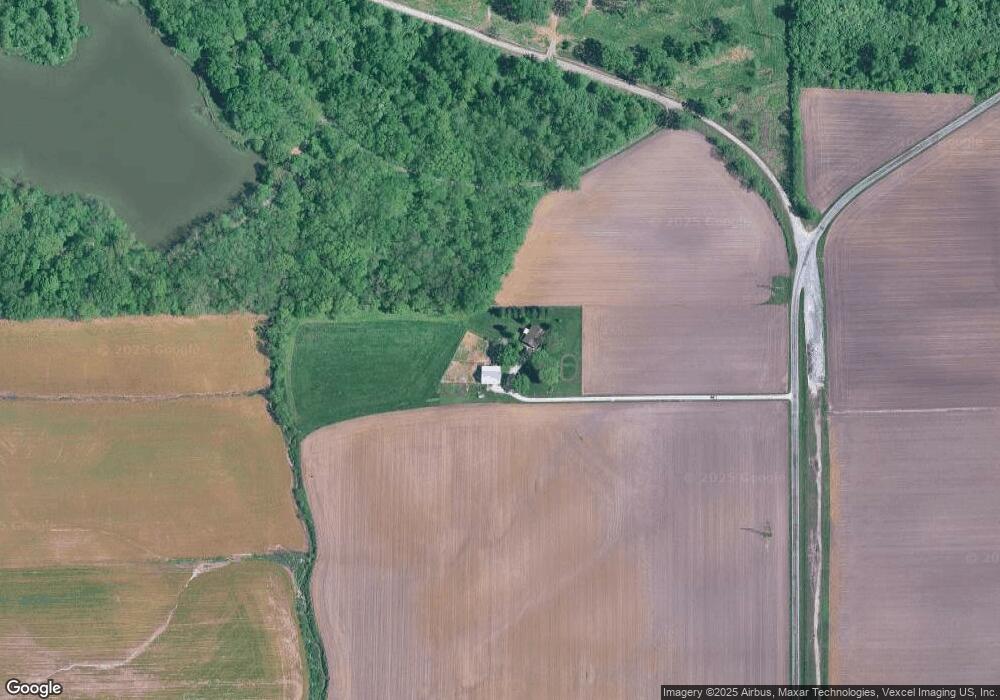
Map
Nearby Homes
- 244 River Laurel Dr
- 2056 Celebration Park Cir
- 1937 Richmond Springs Ln
- 2042 Woodsong Way Ln
- 133 Rivermeade Ln
- 1913 Plantation Ln
- 1909 Plantation Ln
- 91-110 Westhaven Meadows Dr
- 1617 S Illinois St
- 1620 Westhaven Dr
- 46 Meadowview Dr
- 245 Summers Trace
- 1500 State Street Rd
- 800 Springwood Dr
- 324 Lake Forest Dr
- 1433 Fairwood Dr
- 633 Springwood Dr
- 178 Wyndrose Estates Dr
- 1412 Fairwood Dr
- 33 Forest Gate Dr
- 2823 Mulligan Ln
- 2815 Mulligan Ln
- 2845 Mulligan Ln
- 2851 Mulligan Ln
- 2899 Mulligan Ln
- 429 S 131th St
- 2534 Mulligan Ln
- 2749 S Illinois St
- 2635 Belle Mar Dr
- 2625 Belle Mar Dr
- 2617 Belle Mar Dr
- 224 Pecan Lake Dr
- 224 Pecan Lake Dr
- 5871 Kennel Dr
- 2901 S Illinois St
- 2525 Mulligan Ln
- 2609 Belle Mar Dr
- 2707 S Illinois St
- 2508 Mulligan Ln
- 2508 Mulligan Ln