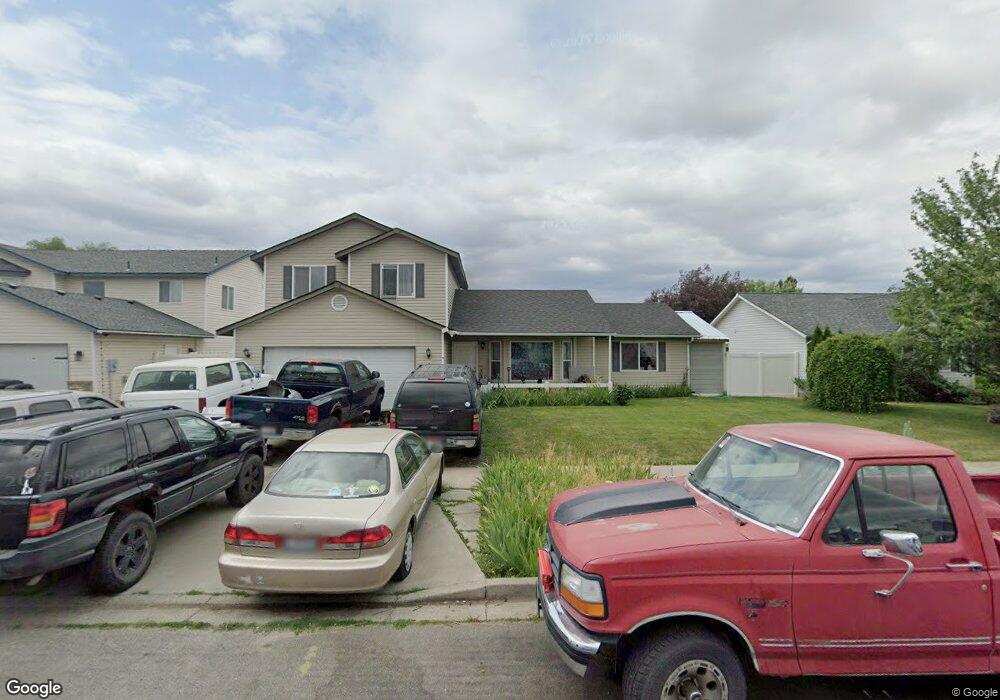
2715 W Beth Loop Post Falls, ID 83854
Estimated Value: $446,000 - $459,000
4
Beds
2
Baths
1,589
Sq Ft
$284/Sq Ft
Est. Value
About This Home
This home is located at 2715 W Beth Loop, Post Falls, ID 83854 and is currently estimated at $451,970, approximately $284 per square foot. 2715 W Beth Loop is a home located in Kootenai County with nearby schools including West Ridge Elementary School, River City Middle School, and Post Falls High School.
Ownership History
Date
Name
Owned For
Owner Type
Purchase Details
Closed on
Apr 8, 2020
Sold by
Nelson Susan Ew and Susan E Nelson Living Trust
Bought by
Tolleson Matthew Lawrence and Tolleson Kathryn Rose
Current Estimated Value
Home Financials for this Owner
Home Financials are based on the most recent Mortgage that was taken out on this home.
Original Mortgage
$190,000
Outstanding Balance
$171,353
Interest Rate
3.5%
Mortgage Type
USDA
Estimated Equity
$280,617
Purchase Details
Closed on
Aug 14, 2017
Sold by
Hood Denise
Bought by
Nelson Susan E and The Susan E Nelson Living Trust
Purchase Details
Closed on
Jan 24, 2005
Sold by
Cougar Creek Properties Llc
Bought by
Diskin Charles
Home Financials for this Owner
Home Financials are based on the most recent Mortgage that was taken out on this home.
Original Mortgage
$124,800
Interest Rate
5.74%
Mortgage Type
New Conventional
Create a Home Valuation Report for This Property
The Home Valuation Report is an in-depth analysis detailing your home's value as well as a comparison with similar homes in the area
Purchase History
| Date | Buyer | Sale Price | Title Company |
|---|---|---|---|
| Tolleson Matthew Lawrence | -- | First American Title Company | |
| Nelson Susan E | -- | Pioneer Title Co | |
| Diskin Charles | -- | None Available |
Source: Public Records
Mortgage History
| Date | Status | Borrower | Loan Amount |
|---|---|---|---|
| Open | Tolleson Matthew Lawrence | $190,000 | |
| Previous Owner | Diskin Charles | $124,800 |
Source: Public Records
Tax History
| Year | Tax Paid | Tax Assessment Tax Assessment Total Assessment is a certain percentage of the fair market value that is determined by local assessors to be the total taxable value of land and additions on the property. | Land | Improvement |
|---|---|---|---|---|
| 2025 | $1,651 | $428,740 | $165,000 | $263,740 |
| 2024 | $1,518 | $393,810 | $130,000 | $263,810 |
| 2023 | $1,518 | $430,345 | $160,000 | $270,345 |
| 2022 | $2,097 | $461,840 | $160,000 | $301,840 |
| 2021 | $1,531 | $272,200 | $110,000 | $162,200 |
| 2020 | $2,741 | $240,230 | $95,000 | $145,230 |
| 2019 | $2,711 | $214,500 | $78,000 | $136,500 |
| 2018 | $2,680 | $192,490 | $68,000 | $124,490 |
| 2017 | $1,341 | $169,910 | $50,000 | $119,910 |
| 2016 | $1,290 | $154,280 | $42,000 | $112,280 |
| 2015 | $1,244 | $145,960 | $32,000 | $113,960 |
| 2013 | $1,216 | $132,020 | $28,000 | $104,020 |
Source: Public Records
Map
Nearby Homes
- 590 N Stephanie St
- 2203 W Jester Way
- 957 N Maranatha Dr
- 1087 N Lean St
- 7250 W Seltice Way
- 2135 W Seltice Way
- 0 W Seltice Way
- 5856 W Seltice Way
- 2087 W Seltice Way
- 2126 Lapwai Ave
- 1513 N Wilhelm Way
- 1521 N Wilhelm Way
- 1531 N Wilhelm Way
- 1435 N Minam Loop
- 0 Pleasant View Rd Unit 26-911
- L1B1 W Riverbend Ave
- 2120 W Platte Ct
- 2084 W Platte Ct
- 2133 W Platte Ct
- 2097 W Platte Ct
- 2693 W Beth Loop
- 2735 W Beth Loop
- 526 N Stephanie St
- 0 W Dawn Ave
- 2675 W Beth Loop
- 2720 W Beth Loop
- 540 N Stephanie St
- 2668 W Dawn Ave
- 2700 W Beth Loop
- 2740 W Beth Loop
- 2682 W Beth Loop
- 2657 W Beth Loop
- 2684 W Dawn Ave
- 2700 W Dawn Ave
- 2652 W Dawn Ave
- 554 N Stephanie St
- 2660 W Beth Loop
- 2740 W Dawn Ave
- 2634 W Dawn Ave
- 2464 W Beth Loop