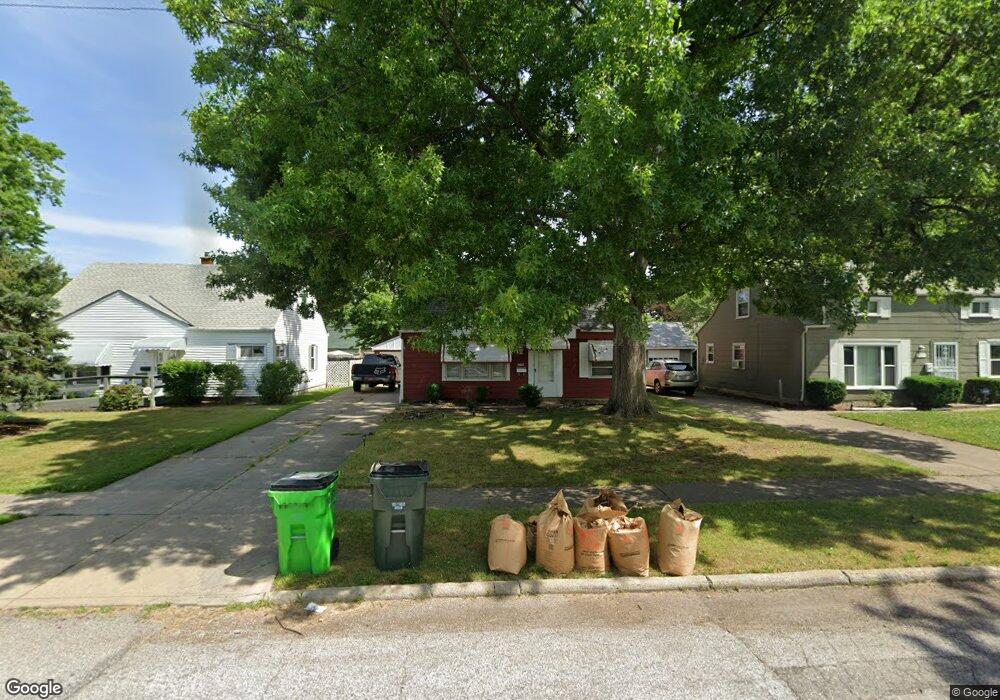
27151 Farringdon Ave Euclid, OH 44132
Estimated Value: $138,092 - $156,000
4
Beds
1
Bath
1,541
Sq Ft
$96/Sq Ft
Est. Value
About This Home
This home is located at 27151 Farringdon Ave, Euclid, OH 44132 and is currently estimated at $147,273, approximately $95 per square foot. 27151 Farringdon Ave is a home located in Cuyahoga County with nearby schools including Shoreview Elementary School, Euclid High School, and Ss. Robert & William Catholic School.
Ownership History
Date
Name
Owned For
Owner Type
Purchase Details
Closed on
May 2, 2022
Sold by
Brown Renetta J
Bought by
Property Cartwheel Llc
Current Estimated Value
Home Financials for this Owner
Home Financials are based on the most recent Mortgage that was taken out on this home.
Original Mortgage
$85,000
Interest Rate
5.7%
Mortgage Type
Balloon
Purchase Details
Closed on
May 9, 2000
Sold by
Berger Dale W and Berger Kimberly L
Bought by
Brown Renetta
Home Financials for this Owner
Home Financials are based on the most recent Mortgage that was taken out on this home.
Original Mortgage
$88,804
Interest Rate
8.26%
Mortgage Type
FHA
Purchase Details
Closed on
May 16, 1990
Sold by
Cramer Thomas L and B A
Bought by
Berger Dale W
Purchase Details
Closed on
Jan 1, 1975
Bought by
Cramer Thomas L and B A
Create a Home Valuation Report for This Property
The Home Valuation Report is an in-depth analysis detailing your home's value as well as a comparison with similar homes in the area
Home Values in the Area
Average Home Value in this Area
Purchase History
| Date | Buyer | Sale Price | Title Company |
|---|---|---|---|
| Property Cartwheel Llc | $85,000 | Richardson Ira A | |
| Brown Renetta | $88,900 | Enterprise Title Agency Inc | |
| Berger Dale W | $65,000 | -- | |
| Cramer Thomas L | -- | -- |
Source: Public Records
Mortgage History
| Date | Status | Borrower | Loan Amount |
|---|---|---|---|
| Previous Owner | Property Cartwheel Llc | $85,000 | |
| Previous Owner | Brown Renetta | $88,804 |
Source: Public Records
Tax History Compared to Growth
Tax History
| Year | Tax Paid | Tax Assessment Tax Assessment Total Assessment is a certain percentage of the fair market value that is determined by local assessors to be the total taxable value of land and additions on the property. | Land | Improvement |
|---|---|---|---|---|
| 2024 | $3,044 | $43,365 | $8,435 | $34,930 |
| 2023 | $2,532 | $28,530 | $6,370 | $22,160 |
| 2022 | $2,431 | $28,525 | $6,370 | $22,155 |
| 2021 | $2,706 | $28,530 | $6,370 | $22,160 |
| 2020 | $2,569 | $24,610 | $5,500 | $19,110 |
| 2019 | $2,308 | $70,300 | $15,700 | $54,600 |
| 2018 | $2,330 | $24,610 | $5,500 | $19,110 |
| 2017 | $2,462 | $21,740 | $4,550 | $17,190 |
| 2016 | $2,468 | $21,740 | $4,550 | $17,190 |
| 2015 | $2,247 | $21,740 | $4,550 | $17,190 |
| 2014 | $2,247 | $21,740 | $4,550 | $17,190 |
Source: Public Records
Map
Nearby Homes
- 27101 Zeman Ave
- 27190 Shoreview Ave
- 712 E 266th St
- 26471 Farringdon Ave
- 780 E 266th St
- 26430 Drakefield Ave
- 559 Sycamore Dr
- 26471 Shoreview Ave
- 26351 Farringdon Ave
- 577 Sycamore Dr
- 635 E 261st St
- 461 E 271st St
- 640 E 261st St
- 26171 Shoreview Ave
- 546 Walnut Dr
- 440 E 271st St
- 26230 Oriole Ave
- 29038 Fuller Ave
- 415 E 266th St
- 405 E 262nd St
- 27171 Farringdon Ave
- 27131 Farringdon Ave
- 27191 Farringdon Ave
- 27101 Farringdon Ave
- 27150 Zeman Ave
- 27170 Zeman Ave
- 27130 Zeman Ave
- 27081 Farringdon Ave
- 27190 Zeman Ave
- 27100 Zeman Ave
- 27150 Farringdon Ave
- 27170 Farringdon Ave
- 27130 Farringdon Ave
- 27080 Zeman Ave
- 27100 Farringdon Ave
- 27190 Farringdon Ave
- 27051 Farringdon Ave
- 27051 Farringdon Ave
- 27080 Farringdon Ave
- 27050 Zeman Ave