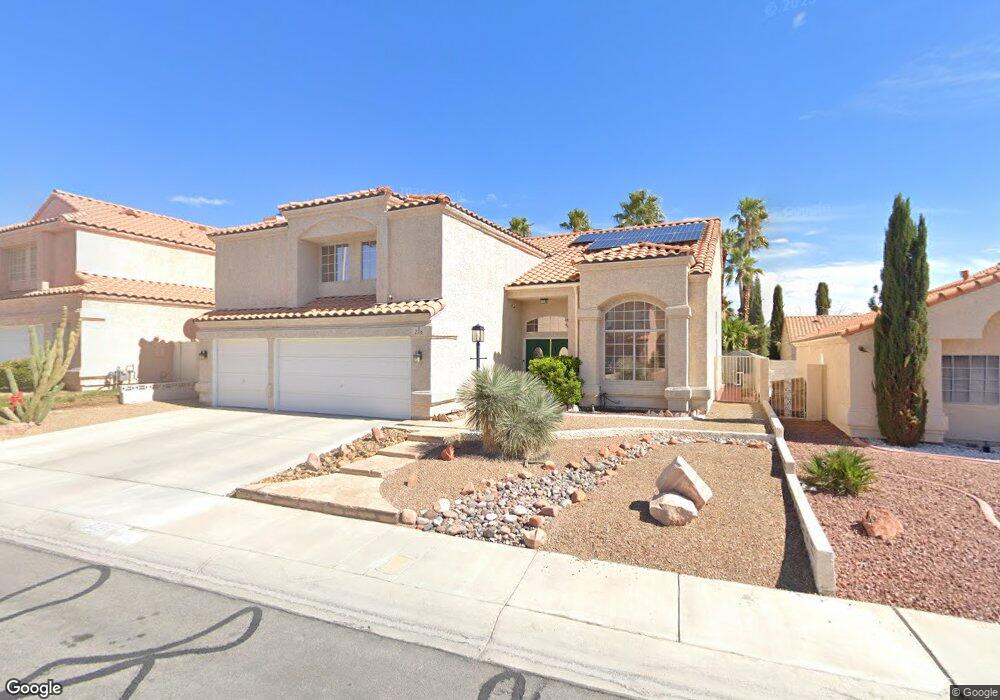
2716 Beachside Ct Las Vegas, NV 89117
The Section Seven NeighborhoodEstimated Value: $658,316 - $791,000
6
Beds
3
Baths
2,951
Sq Ft
$246/Sq Ft
Est. Value
About This Home
This home is located at 2716 Beachside Ct, Las Vegas, NV 89117 and is currently estimated at $727,329, approximately $246 per square foot. 2716 Beachside Ct is a home located in Clark County with nearby schools including D'Vorre & Hal Ober Elementary School, Victoria Fertitta Middle School, and Bonanza High School.
Create a Home Valuation Report for This Property
The Home Valuation Report is an in-depth analysis detailing your home's value as well as a comparison with similar homes in the area
Home Values in the Area
Average Home Value in this Area
Tax History Compared to Growth
Tax History
| Year | Tax Paid | Tax Assessment Tax Assessment Total Assessment is a certain percentage of the fair market value that is determined by local assessors to be the total taxable value of land and additions on the property. | Land | Improvement |
|---|---|---|---|---|
| 2025 | $3,281 | $130,324 | $42,350 | $87,974 |
| 2024 | $3,186 | $130,324 | $42,350 | $87,974 |
| 2023 | $3,186 | $126,326 | $42,000 | $84,326 |
| 2022 | $3,093 | $108,686 | $30,800 | $77,886 |
| 2021 | $3,140 | $102,846 | $28,350 | $74,496 |
| 2020 | $2,912 | $102,052 | $27,650 | $74,402 |
| 2019 | $2,730 | $97,316 | $23,450 | $73,866 |
| 2018 | $2,605 | $94,012 | $22,750 | $71,262 |
| 2017 | $3,110 | $94,857 | $22,050 | $72,807 |
| 2016 | $2,438 | $90,011 | $16,800 | $73,211 |
| 2015 | $2,433 | $73,940 | $11,900 | $62,040 |
| 2014 | $2,362 | $69,900 | $8,750 | $61,150 |
Source: Public Records
Map
Nearby Homes
- 2729 Beachside Ct
- 2724 Monrovia Dr
- 2728 Monrovia Dr
- 9708 Blazing Star Ct
- 9544 Lazy River Dr
- 2300 Storkspur Way
- 9724 Cascade Falls Ave
- 2821 Willow Wind Ct
- 3001 Bridge Creek St
- 9713 Cascade Falls Ave
- 2704 Messina Ct
- 2112 Marble Gorge Dr
- 2112 Preakness Pass Unit A
- 2909 Ivory Reef Ct
- 9429 Abalone Way
- 2153 Jade Creek St Unit 106
- 9717 Sierra Mesa Ave
- 2152 Quarry Ridge St Unit 207
- 9605 Blowing Sand Cir
- 9624 Beach Water Cir
- 2720 Beachside Ct
- 2712 Beachside Ct
- 2717 Monrovia Dr Unit 2
- 2713 Monrovia Dr
- 2721 Monrovia Dr
- 2724 Beachside Ct
- 2709 Monrovia Dr
- 2717 Beachside Ct
- 2721 Beachside Ct
- 2725 Monrovia Dr
- 2728 Beachside Ct Unit 2
- 2704 Beachside Ct
- 2725 Beachside Ct
- 2705 Monrovia Dr
- 2709 Beachside Ct
- 2729 Monrovia Dr
- 0 Monrovia Dr
- 2732 Beachside Ct
- 2716 Grafton Ct