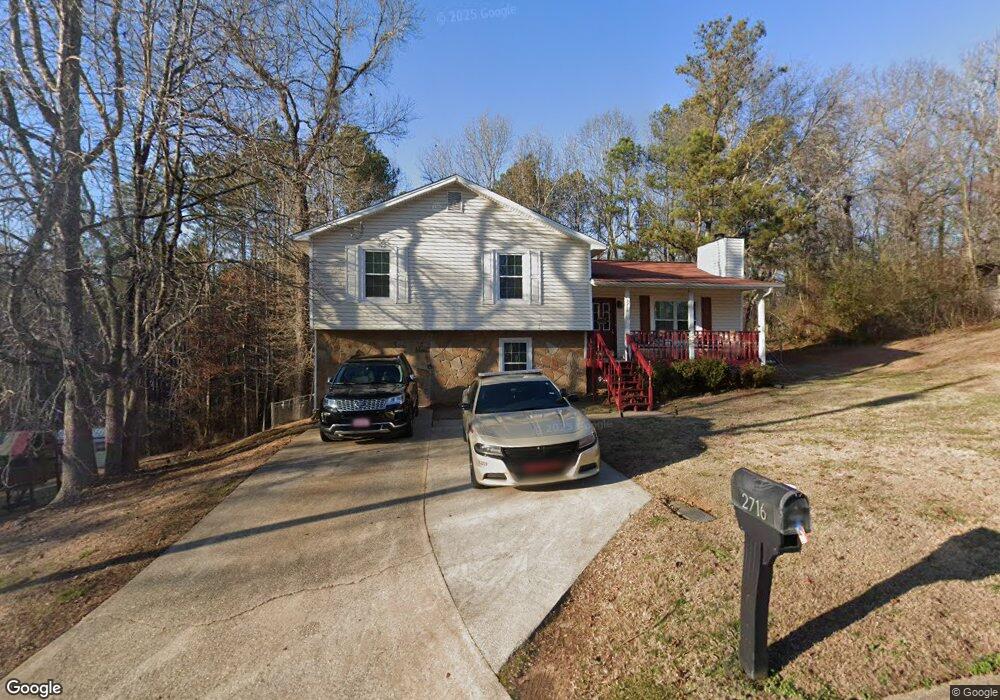
2716 Del Ridge Dr Unit 2 Douglasville, GA 30135
Lithia Springs NeighborhoodEstimated Value: $256,000 - $261,000
3
Beds
2
Baths
1,312
Sq Ft
$197/Sq Ft
Est. Value
About This Home
This home is located at 2716 Del Ridge Dr Unit 2, Douglasville, GA 30135 and is currently estimated at $258,761, approximately $197 per square foot. 2716 Del Ridge Dr Unit 2 is a home located in Douglas County with nearby schools including Factory Shoals Elementary School, Factory Shoals Middle School, and New Manchester High School.
Ownership History
Date
Name
Owned For
Owner Type
Purchase Details
Closed on
Mar 27, 2001
Sold by
Beall Timothy V
Bought by
Thompson Gearlene
Current Estimated Value
Home Financials for this Owner
Home Financials are based on the most recent Mortgage that was taken out on this home.
Original Mortgage
$90,600
Interest Rate
6.98%
Mortgage Type
New Conventional
Purchase Details
Closed on
Aug 19, 1999
Sold by
Hud
Bought by
Beall Timothy V
Home Financials for this Owner
Home Financials are based on the most recent Mortgage that was taken out on this home.
Original Mortgage
$72,393
Interest Rate
7.76%
Mortgage Type
FHA
Purchase Details
Closed on
Mar 11, 1996
Sold by
Hud
Bought by
Spencer Stephen L Vanessa
Purchase Details
Closed on
Oct 3, 1995
Sold by
Chemical Mort
Bought by
Hud
Create a Home Valuation Report for This Property
The Home Valuation Report is an in-depth analysis detailing your home's value as well as a comparison with similar homes in the area
Home Values in the Area
Average Home Value in this Area
Purchase History
| Date | Buyer | Sale Price | Title Company |
|---|---|---|---|
| Thompson Gearlene | $95,400 | -- | |
| Beall Timothy V | -- | -- | |
| Spencer Stephen L Vanessa | -- | -- | |
| Hud | -- | -- | |
| Chemical Mort | $57,000 | -- |
Source: Public Records
Mortgage History
| Date | Status | Borrower | Loan Amount |
|---|---|---|---|
| Previous Owner | Thompson Gearlene | $90,600 | |
| Previous Owner | Beall Timothy V | $72,393 | |
| Closed | Spencer Stephen L Vanessa | $0 |
Source: Public Records
Tax History Compared to Growth
Tax History
| Year | Tax Paid | Tax Assessment Tax Assessment Total Assessment is a certain percentage of the fair market value that is determined by local assessors to be the total taxable value of land and additions on the property. | Land | Improvement |
|---|---|---|---|---|
| 2024 | $2,018 | $85,720 | $14,000 | $71,720 |
| 2023 | $2,018 | $69,840 | $14,000 | $55,840 |
| 2022 | $1,766 | $69,840 | $14,000 | $55,840 |
| 2021 | $1,446 | $55,400 | $14,840 | $40,560 |
| 2020 | $1,291 | $46,400 | $11,440 | $34,960 |
| 2019 | $1,208 | $45,440 | $11,440 | $34,000 |
| 2018 | $1,107 | $40,280 | $10,440 | $29,840 |
| 2017 | $894 | $31,480 | $8,960 | $22,520 |
| 2016 | $918 | $31,760 | $9,280 | $22,480 |
| 2015 | $840 | $28,840 | $8,720 | $20,120 |
| 2014 | $737 | $25,296 | $8,080 | $17,216 |
| 2013 | -- | $27,608 | $8,840 | $18,768 |
Source: Public Records
Map
Nearby Homes
- 2756 Del Ridge Dr
- 2656 Del Ridge Dr
- 2619 Del Ridge Dr
- 3188 Christopher Ct
- 0 Mountain Brook Ct Unit 10435858
- 0 Mountain Brook Ct Unit 7505252
- 3006 Blake Ct
- 2928 Legion Lake Rd
- 2970 Pritchards Mill Trail
- 2785 Fairburn Rd
- 2450 Washington Dr
- 2915 Wilkes Plantation Way
- 2853 Melanie Ln
- 2870 Aunt Pitty Pat Ln
- 3075 Tara Woods Dr
- 3073 Virginia Place
- 3060 Wilkes Plantation Way
- 3327 Surveyor Ct
- 2726 Del Ridge Dr Unit 2
- 2731 Del Ridge Dr
- 2736 Del Ridge Dr
- 2751 Del Ridge Dr Unit 2
- 2696 Del Ridge Dr
- 2701 Del Ridge Dr Unit 2
- 2701 Del Ridge
- 0 Del Ridge
- 3088 Clearwater Dr
- 2761 Del Ridge Dr Unit 2
- 2746 Del Ridge Dr
- 2686 Del Ridge Dr
- 3100 Clearwater Dr
- 3100 Clearwater Dr Unit 3
- 2771 Del Ridge Dr
- 2676 Del Ridge Dr
- 3083 Clearwater Dr
- 2687 Del Ridge Dr
- 2687 Del Ridge Dr Unit 2
- 3110 Clearwater Dr