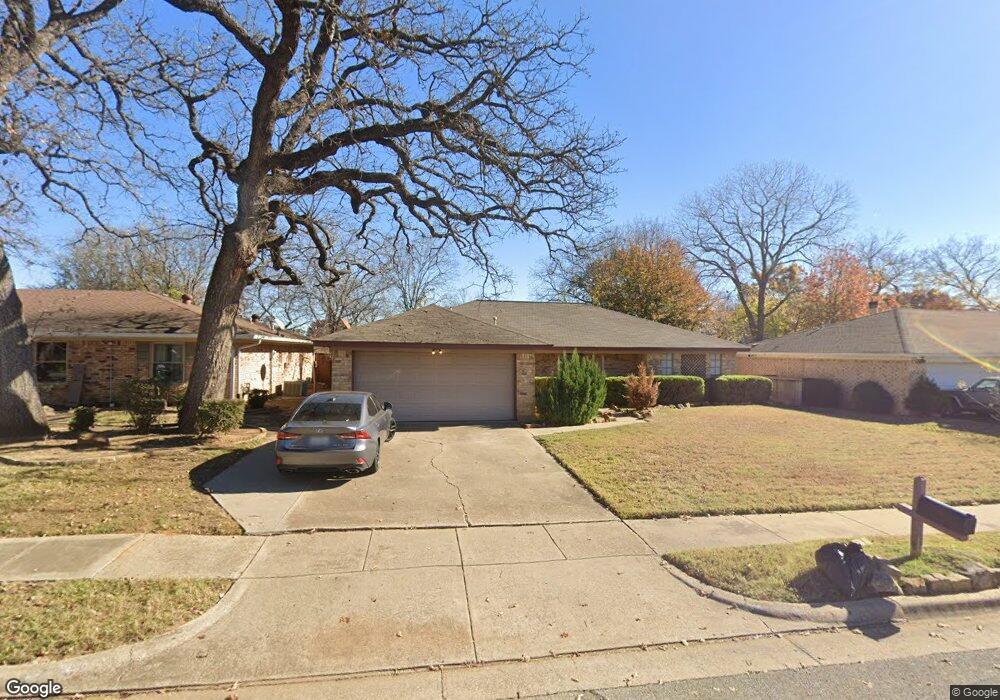
2716 Meadow Green Bedford, TX 76021
Estimated Value: $370,603 - $426,000
3
Beds
2
Baths
1,750
Sq Ft
$230/Sq Ft
Est. Value
About This Home
This home is located at 2716 Meadow Green, Bedford, TX 76021 and is currently estimated at $402,901, approximately $230 per square foot. 2716 Meadow Green is a home located in Tarrant County with nearby schools including Meadow Creek Elementary School, Harwood Junior High School, and Trinity High School.
Ownership History
Date
Name
Owned For
Owner Type
Purchase Details
Closed on
Feb 26, 2020
Sold by
Fry Christopher
Bought by
Swindell Edie Fontana and 2716 Meadow Green Trust
Current Estimated Value
Purchase Details
Closed on
Jan 31, 2005
Sold by
Ledbetter Brett C and Ledbetter Angela K
Bought by
Fry Christopher M
Home Financials for this Owner
Home Financials are based on the most recent Mortgage that was taken out on this home.
Original Mortgage
$99,600
Interest Rate
5.85%
Mortgage Type
Purchase Money Mortgage
Purchase Details
Closed on
Dec 2, 1999
Sold by
Burrough David Ray and Burrough Gladys Kay
Bought by
Ledbetter Brett C and Ledbetter Angela K
Home Financials for this Owner
Home Financials are based on the most recent Mortgage that was taken out on this home.
Original Mortgage
$98,108
Interest Rate
7.95%
Mortgage Type
FHA
Create a Home Valuation Report for This Property
The Home Valuation Report is an in-depth analysis detailing your home's value as well as a comparison with similar homes in the area
Home Values in the Area
Average Home Value in this Area
Purchase History
| Date | Buyer | Sale Price | Title Company |
|---|---|---|---|
| Swindell Edie Fontana | -- | None Available | |
| Fry Christopher M | -- | First Land Title | |
| Ledbetter Brett C | -- | Safeco Land Title |
Source: Public Records
Mortgage History
| Date | Status | Borrower | Loan Amount |
|---|---|---|---|
| Previous Owner | Fry Christopher M | $99,600 | |
| Previous Owner | Ledbetter Brett C | $98,108 |
Source: Public Records
Tax History Compared to Growth
Tax History
| Year | Tax Paid | Tax Assessment Tax Assessment Total Assessment is a certain percentage of the fair market value that is determined by local assessors to be the total taxable value of land and additions on the property. | Land | Improvement |
|---|---|---|---|---|
| 2025 | $7,241 | $302,254 | $75,000 | $227,254 |
| 2024 | $7,241 | $371,935 | $75,000 | $296,935 |
| 2023 | $5,962 | $310,847 | $50,000 | $260,847 |
| 2022 | $7,068 | $323,612 | $50,000 | $273,612 |
| 2021 | $6,451 | $273,874 | $50,000 | $223,874 |
| 2020 | $5,587 | $235,000 | $50,000 | $185,000 |
| 2019 | $5,709 | $235,000 | $50,000 | $185,000 |
| 2018 | $5,175 | $213,000 | $50,000 | $163,000 |
| 2017 | $4,748 | $196,261 | $35,000 | $161,261 |
| 2016 | $4,384 | $181,239 | $35,000 | $146,239 |
| 2015 | $3,651 | $145,400 | $18,000 | $127,400 |
| 2014 | $3,651 | $145,400 | $18,000 | $127,400 |
Source: Public Records
Map
Nearby Homes
- 2516 Classic Ct W
- 2521 Sanders Ct
- 2601 Murphy Dr
- 2501 Murphy Dr
- 2922 Beachtree Ln
- 2609 Woodson Dr
- 2417 Meadow Ct
- 2909 Oakridge Dr
- 2616 Greenwood Ct
- 2700 Mimosa Ct
- 2220 Tiffany Glenn Ct
- 3024 Highgate Ln
- 2600 Willow Bend
- 2300 Folkstone Way
- 2709 Willow Bend
- 3152 Woodbridge Dr
- 2109 Oakmeadow St
- 2024 Oakmeadow St
- 2112 Oakmeadow Place
- 2522 Durango Ridge Dr
- 2720 Meadow Green
- 2712 Meadow Green
- 2708 Meadow Green
- 2724 Meadow Green
- 2708 Meadow Green
- 2505 Classic Ct W
- 2717 Meadow Green
- 2717 Meadow Green
- 2721 Meadow Green
- 2501 Classic Ct W
- 2713 Meadow Green
- 2704 Meadow Green
- 2728 Meadow Green
- 2709 Meadow Green
- 2725 Meadow Green
- 2725 Meadow Green
- 2504 Sanders Ct
- 2709 Meadow Green
- 2509 Classic Ct W
- 2500 Classic Ct W