
Seller's Agent in 2018
Adam Lambert
AEL Properties LLC
(713) 471-2326
126 Total Sales

Estimated Value: $225,000 - $229,000
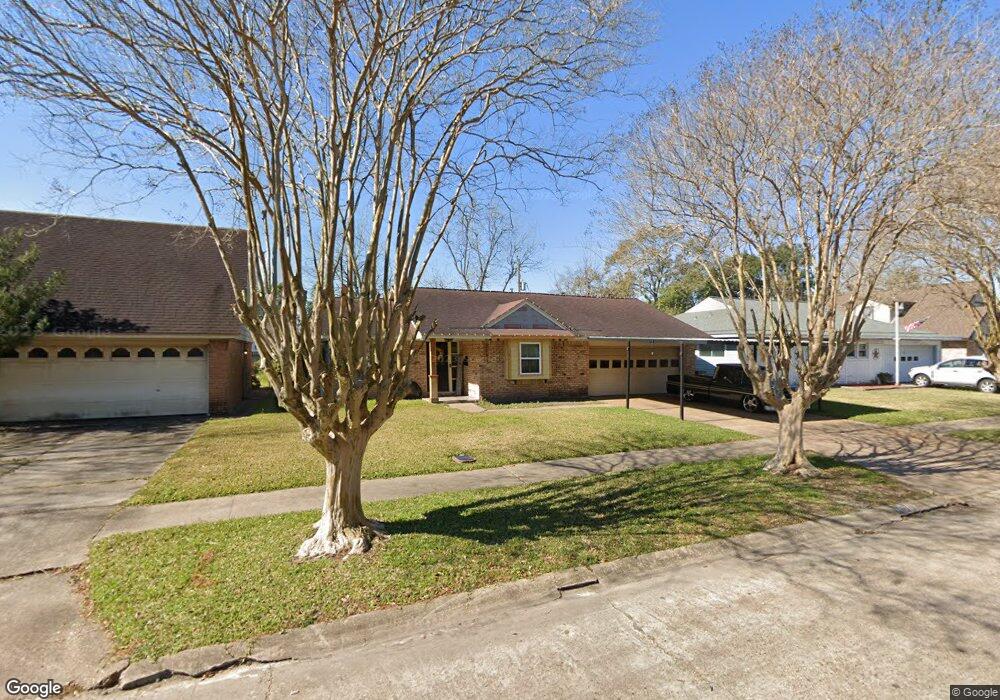
This 3 bedroom/2 bathroom home has been very well maintained and is in immaculate condition! Hardwoods throughout and carpet is neutral and in very good condition. Nice patio with a spacious backyard perfect for entertaining. Schedule an appointment to view this home today!
Last Agent to Sell the Property
AEL Properties LLC License #0593003 Listed on: 09/14/2018
| Date | Buyer | Sale Price | Title Company |
|---|---|---|---|
| Pena Jesse Anthony | -- | Superior Abstract & Title | |
| Ael Properties Llc | -- | Superior Abstract & Title | |
| Garcia Erika | -- | First American Title |
| Date | Status | Borrower | Loan Amount |
|---|---|---|---|
| Open | Pena Jesse Anthony | $145,403 | |
| Previous Owner | Ael Properties Llc | $109,000 | |
| Previous Owner | Garcia Erika | $87,618 |
| Date | Event | Price | List to Sale | Price per Sq Ft |
|---|---|---|---|---|
| 12/30/2021 12/30/21 | Off Market | -- | -- | -- |
| 10/19/2018 10/19/18 | Sold | -- | -- | -- |
| 09/19/2018 09/19/18 | Pending | -- | -- | -- |
| 09/14/2018 09/14/18 | For Sale | $149,900 | -- | $111 / Sq Ft |
| Year | Tax Paid | Tax Assessment Tax Assessment Total Assessment is a certain percentage of the fair market value that is determined by local assessors to be the total taxable value of land and additions on the property. | Land | Improvement |
|---|---|---|---|---|
| 2025 | $3,294 | $232,204 | $58,798 | $173,406 |
| 2024 | $3,294 | $224,549 | $58,798 | $165,751 |
| 2023 | $3,294 | $229,290 | $58,798 | $170,492 |
| 2022 | $4,136 | $181,158 | $58,798 | $122,360 |
| 2021 | $3,950 | $148,980 | $42,465 | $106,515 |
| 2020 | $4,193 | $152,815 | $42,465 | $110,350 |
| 2019 | $4,413 | $151,644 | $32,666 | $118,978 |
| 2018 | $1,462 | $121,546 | $32,666 | $88,880 |
| 2017 | $3,334 | $121,546 | $32,666 | $88,880 |
| 2016 | $3,067 | $111,820 | $22,866 | $88,954 |
| 2015 | $2,539 | $96,577 | $22,866 | $73,711 |
| 2014 | $2,539 | $92,362 | $21,559 | $70,803 |
Seller's Agent in 2018
Adam Lambert
AEL Properties LLC
(713) 471-2326
126 Total Sales
Buyer's Agent in 2018
Melissa Pompa
Keller Williams Summit
(832) 722-6687
142 Total Sales
Source: Houston Association of REALTORS®
MLS Number: 25222026
APN: 0925050000008
Disclaimer: Certain information contained herein is derived from information provided by parties other than Homes.com. All information provided is deemed reliable, but is not guaranteed to be accurate and should be independently verified.
![]() Copyright 2026, Houston REALTORS® Information Service, Inc.
Copyright 2026, Houston REALTORS® Information Service, Inc.
The information provided is exclusively for consumers’ personal, non-commercial use, and may not be used for any purpose other than to identify prospective properties consumers may be interested in purchasing.
Information is deemed reliable but not guaranteed.
Ask me questions while you tour the home.