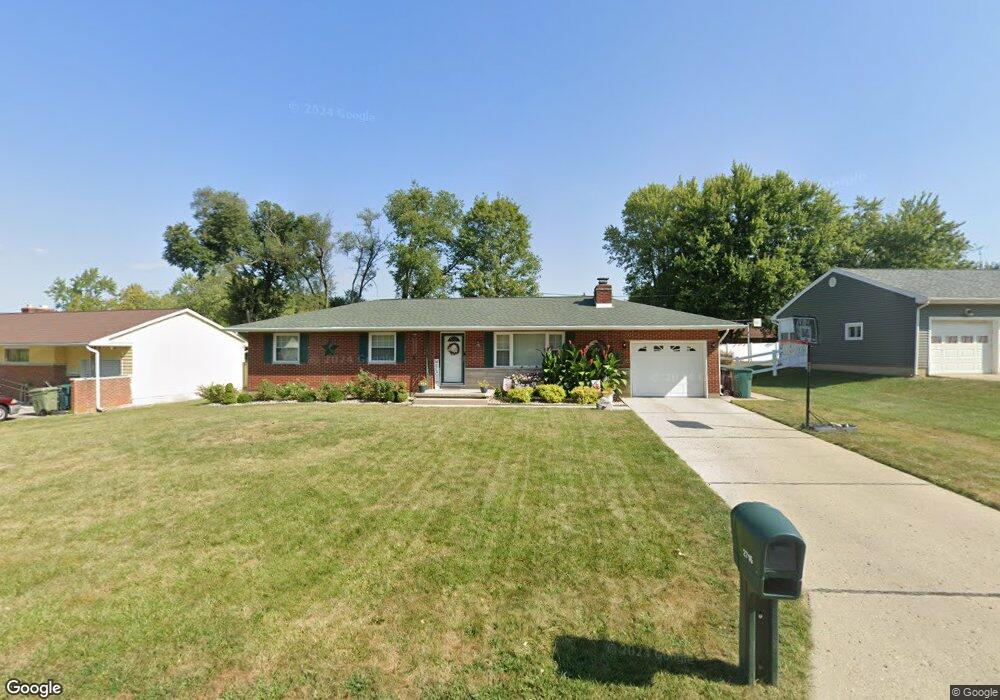
2716 S D St Richmond, IN 47374
Estimated Value: $165,818 - $181,000
3
Beds
2
Baths
1,200
Sq Ft
$142/Sq Ft
Est. Value
About This Home
This home is located at 2716 S D St, Richmond, IN 47374 and is currently estimated at $170,955, approximately $142 per square foot. 2716 S D St is a home located in Wayne County with nearby schools including Charles Elementary School, Julia E. Test Intermediate School, and Richmond High School.
Ownership History
Date
Name
Owned For
Owner Type
Purchase Details
Closed on
May 22, 2019
Sold by
Delong Jeffrey S and Delong Wendy A
Bought by
Delong Wendy A
Current Estimated Value
Home Financials for this Owner
Home Financials are based on the most recent Mortgage that was taken out on this home.
Original Mortgage
$100,325
Outstanding Balance
$88,559
Interest Rate
4.4%
Mortgage Type
FHA
Estimated Equity
$82,396
Purchase Details
Closed on
Jan 18, 2008
Sold by
Maness Clara M
Bought by
Delong Jeffrey S and Delong Wendy A
Home Financials for this Owner
Home Financials are based on the most recent Mortgage that was taken out on this home.
Original Mortgage
$90,086
Interest Rate
5.95%
Mortgage Type
FHA
Create a Home Valuation Report for This Property
The Home Valuation Report is an in-depth analysis detailing your home's value as well as a comparison with similar homes in the area
Home Values in the Area
Average Home Value in this Area
Purchase History
| Date | Buyer | Sale Price | Title Company |
|---|---|---|---|
| Delong Wendy A | -- | -- | |
| Delong Jeffrey S | -- | -- |
Source: Public Records
Mortgage History
| Date | Status | Borrower | Loan Amount |
|---|---|---|---|
| Open | Delong Wendy A | $100,325 | |
| Previous Owner | Delong Jeffrey S | $90,086 |
Source: Public Records
Tax History Compared to Growth
Tax History
| Year | Tax Paid | Tax Assessment Tax Assessment Total Assessment is a certain percentage of the fair market value that is determined by local assessors to be the total taxable value of land and additions on the property. | Land | Improvement |
|---|---|---|---|---|
| 2024 | $1,241 | $124,100 | $20,100 | $104,000 |
| 2023 | $1,086 | $108,600 | $17,600 | $91,000 |
| 2022 | $1,054 | $105,400 | $17,200 | $88,200 |
| 2021 | $981 | $98,100 | $17,200 | $80,900 |
| 2020 | $960 | $96,000 | $17,200 | $78,800 |
| 2019 | $939 | $93,900 | $17,200 | $76,700 |
| 2018 | $965 | $96,500 | $17,200 | $79,300 |
| 2017 | $973 | $97,300 | $17,200 | $80,100 |
| 2016 | $951 | $95,100 | $17,200 | $77,900 |
| 2014 | $764 | $85,100 | $17,200 | $67,900 |
| 2013 | $764 | $89,400 | $17,200 | $72,200 |
Source: Public Records
Map
Nearby Homes