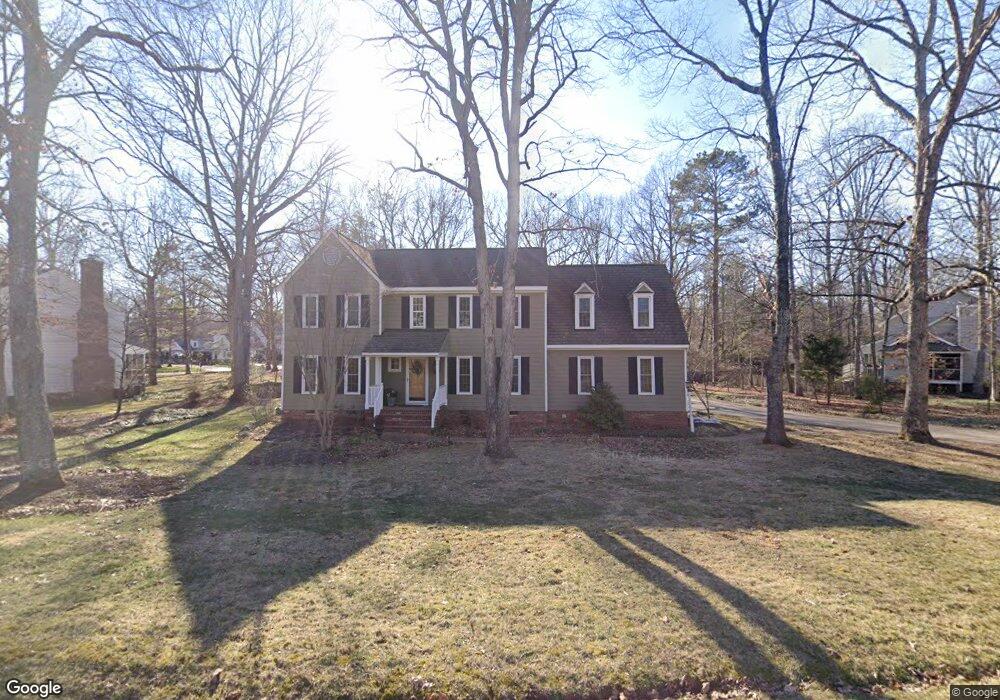
2716 Swanhurst Dr Midlothian, VA 23113
Roxshire NeighborhoodEstimated Value: $662,598 - $710,000
4
Beds
3
Baths
2,922
Sq Ft
$232/Sq Ft
Est. Value
About This Home
This home is located at 2716 Swanhurst Dr, Midlothian, VA 23113 and is currently estimated at $678,900, approximately $232 per square foot. 2716 Swanhurst Dr is a home located in Chesterfield County with nearby schools including Robious Elementary School, Robious Middle School, and James River High School.
Ownership History
Date
Name
Owned For
Owner Type
Purchase Details
Closed on
Jun 19, 2001
Sold by
Burns David A
Bought by
Shepard Bruce G and Shepard Christine K
Current Estimated Value
Home Financials for this Owner
Home Financials are based on the most recent Mortgage that was taken out on this home.
Original Mortgage
$180,000
Outstanding Balance
$67,809
Interest Rate
7.15%
Mortgage Type
New Conventional
Estimated Equity
$611,091
Purchase Details
Closed on
Jul 9, 1999
Sold by
Moore Betsy H
Bought by
Burns David A and Burns Diane M
Home Financials for this Owner
Home Financials are based on the most recent Mortgage that was taken out on this home.
Original Mortgage
$171,000
Interest Rate
7.19%
Mortgage Type
New Conventional
Purchase Details
Closed on
Aug 11, 1997
Sold by
Separated Moore
Bought by
Separated Moore
Create a Home Valuation Report for This Property
The Home Valuation Report is an in-depth analysis detailing your home's value as well as a comparison with similar homes in the area
Home Values in the Area
Average Home Value in this Area
Purchase History
| Date | Buyer | Sale Price | Title Company |
|---|---|---|---|
| Shepard Bruce G | $229,500 | -- | |
| Burns David A | $180,000 | -- | |
| Separated Moore | -- | -- |
Source: Public Records
Mortgage History
| Date | Status | Borrower | Loan Amount |
|---|---|---|---|
| Open | Separated Moore | $180,000 | |
| Previous Owner | Separated Moore | $171,000 |
Source: Public Records
Tax History Compared to Growth
Tax History
| Year | Tax Paid | Tax Assessment Tax Assessment Total Assessment is a certain percentage of the fair market value that is determined by local assessors to be the total taxable value of land and additions on the property. | Land | Improvement |
|---|---|---|---|---|
| 2025 | $5,224 | $584,200 | $145,000 | $439,200 |
| 2024 | $5,224 | $554,700 | $135,000 | $419,700 |
| 2023 | $5,017 | $478,200 | $125,000 | $353,200 |
| 2022 | $4,160 | $452,200 | $115,000 | $337,200 |
| 2021 | $3,899 | $407,800 | $104,000 | $303,800 |
| 2020 | $3,730 | $392,600 | $104,000 | $288,600 |
| 2019 | $3,701 | $389,600 | $101,000 | $288,600 |
| 2018 | $3,564 | $375,200 | $99,000 | $276,200 |
| 2017 | $3,583 | $373,200 | $97,000 | $276,200 |
| 2016 | $3,568 | $371,700 | $97,000 | $274,700 |
| 2015 | $3,492 | $363,700 | $89,000 | $274,700 |
| 2014 | $3,381 | $352,200 | $82,000 | $270,200 |
Source: Public Records
Map
Nearby Homes
- 2735 Swanhurst Dr
- 12602 Foxstone Ct
- 12931 River Hills Dr
- 3010 Middlewood Rd
- 13449 Glendower Rd
- 12213 Capwell Dr
- 2725 Stonegate Ct
- 3437 Kendal Crossing Terrace
- 2300 Cranborne Rd
- 13637 Langford Dr
- 2303 Bream Dr
- 3400 Hemmingstone Ct
- 3530 Old Gun Rd W
- 11814 N Briar Patch Dr
- 13327 Ellerton Terrace
- 11815 N Briar Patch Dr
- 11763 N Briar Patch Dr
- 11714 S Briar Patch Dr
- 11911 Kilrenny Rd
- 11627 E Briar Patch Dr
- 2700 Swanhurst Dr
- 2730 Swanhurst Dr
- 12720 Foxstone Rd
- 2725 Swanhurst Dr
- 2717 Swanhurst Dr
- 2709 Swanhurst Dr
- 2744 Swanhurst Dr
- 12730 Foxstone Rd
- 2701 Swanhurst Dr
- 12701 Foxstone Rd
- 2801 Swanhurst Dr
- 12740 Foxstone Rd
- 2745 Swanhurst Dr
- 12721 Foxstone Rd
- 12611 Foxstone Ct
- 12731 Foxstone Rd
- 2811 Swanhurst Dr
- 12800 Foxstone Rd
- 2611 Swanhurst Dr
- 12741 Foxstone Rd