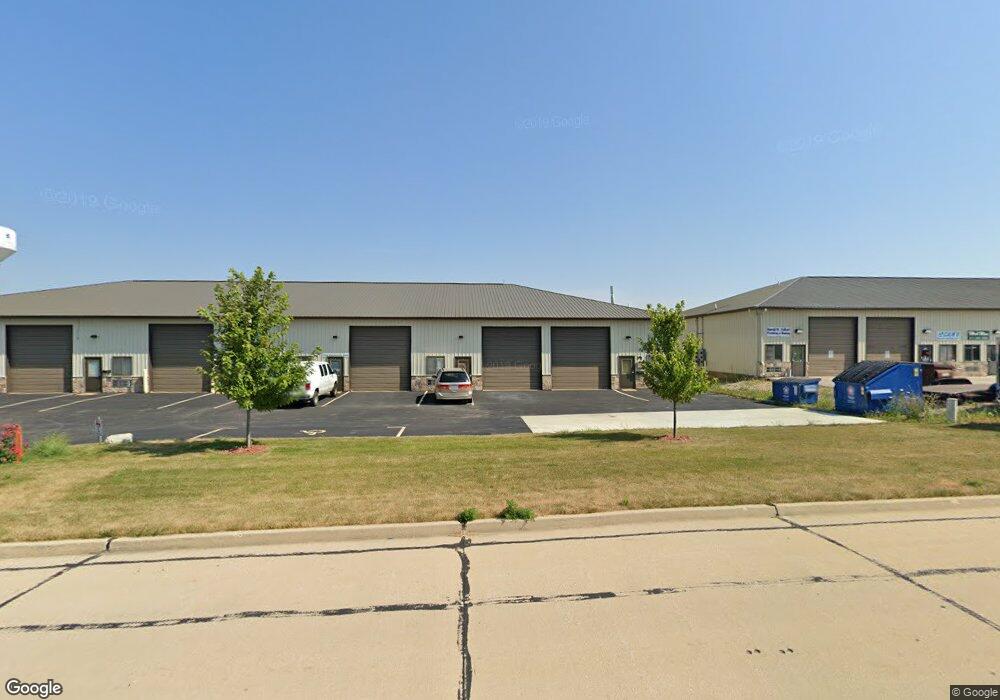
2716 W Clark Rd Unit B Champaign, IL 61822
Estimated Value: $149,104
--
Bed
--
Bath
--
Sq Ft
1,394
Sq Ft Lot
About This Home
This home is located at 2716 W Clark Rd Unit B, Champaign, IL 61822 and is currently estimated at $149,104. 2716 W Clark Rd Unit B is a home located in Champaign County with nearby schools including Centennial High School, St. John Lutheran School, and Swann Special Care Center-Elem/Secondary School.
Ownership History
Date
Name
Owned For
Owner Type
Purchase Details
Closed on
Jun 15, 2020
Sold by
Cassel Chad
Bought by
North James
Current Estimated Value
Purchase Details
Closed on
May 30, 2012
Sold by
Murphy John F
Bought by
Cassel Chad
Home Financials for this Owner
Home Financials are based on the most recent Mortgage that was taken out on this home.
Original Mortgage
$72,000
Interest Rate
3.92%
Mortgage Type
Commercial
Purchase Details
Closed on
Sep 1, 2010
Sold by
Woller Terry D
Bought by
Murphy John F
Purchase Details
Closed on
Oct 14, 2008
Sold by
Bankchampaign Na
Bought by
Woller Terry D
Home Financials for this Owner
Home Financials are based on the most recent Mortgage that was taken out on this home.
Original Mortgage
$76,500
Interest Rate
6.48%
Mortgage Type
Commercial
Create a Home Valuation Report for This Property
The Home Valuation Report is an in-depth analysis detailing your home's value as well as a comparison with similar homes in the area
Home Values in the Area
Average Home Value in this Area
Purchase History
| Date | Buyer | Sale Price | Title Company |
|---|---|---|---|
| North James | $100,000 | Act | |
| Cassel Chad | $86,000 | None Available | |
| Murphy John F | $87,000 | None Available | |
| Woller Terry D | $85,000 | None Available |
Source: Public Records
Mortgage History
| Date | Status | Borrower | Loan Amount |
|---|---|---|---|
| Previous Owner | Cassel Chad | $72,000 | |
| Previous Owner | Woller Terry D | $76,500 |
Source: Public Records
Tax History Compared to Growth
Tax History
| Year | Tax Paid | Tax Assessment Tax Assessment Total Assessment is a certain percentage of the fair market value that is determined by local assessors to be the total taxable value of land and additions on the property. | Land | Improvement |
|---|---|---|---|---|
| 2024 | $2,946 | $35,870 | $6,840 | $29,030 |
| 2023 | $2,946 | $32,670 | $6,230 | $26,440 |
| 2022 | $2,772 | $30,140 | $5,750 | $24,390 |
| 2021 | $2,552 | $27,880 | $5,320 | $22,560 |
| 2020 | $2,556 | $27,880 | $5,320 | $22,560 |
| 2019 | $2,474 | $27,310 | $5,210 | $22,100 |
| 2018 | $2,419 | $26,880 | $5,130 | $21,750 |
| 2017 | $2,429 | $26,880 | $5,130 | $21,750 |
| 2016 | $2,177 | $26,320 | $5,020 | $21,300 |
| 2015 | $2,193 | $25,850 | $4,930 | $20,920 |
| 2014 | $2,175 | $25,850 | $4,930 | $20,920 |
| 2013 | $2,155 | $25,850 | $4,930 | $20,920 |
Source: Public Records
Map
Nearby Homes
- 423 Clearwater Dr Unit 423
- 2537 Clayton Blvd
- 803 Irvine Rd Unit 803
- 2702 Heritage Dr
- 2712 Heritage Dr Unit 2712
- 2416 Heritage Dr
- 3207 Ridgewood Dr
- 708 S Duncan Rd
- 806 Scottsdale Dr
- 3103 Timberline Dr
- 615 Erin Dr
- 905 S Duncan Rd
- 709 Erin Dr
- 1704 W Church St
- 801 Erin Dr
- 752 Sedgegrass Dr
- 754 Sedgegrass Dr
- 756 Sedgegrass Dr
- 800 Sedgegrass Dr
- 802 Sedgegrass Dr
- 2716 W Clark Rd
- 2716 W Clark Rd Unit D
- 2716 W Clark Rd Unit E
- 2714 W Clark Rd Unit E
- 2713 Hundman
- 2715 Hundman
- 2714 W Clark Rd Unit D
- 2714 W Clark Rd Unit F
- 2714 W Clark Rd Unit F
- 2714 W Clark Rd Unit E
- 2714 W Clark Rd
- 2714 W Clark Rd
- 2714 W Clark Rd Unit E
- 2714 W Clark Rd Unit D
- 2714 W Clark Rd Unit C
- 2718 W Clark Rd
- 2714F W Clark Rd Unit F
- 2714F W Clark Rd
- 2704 W Clark Rd
- 2801 Hundman