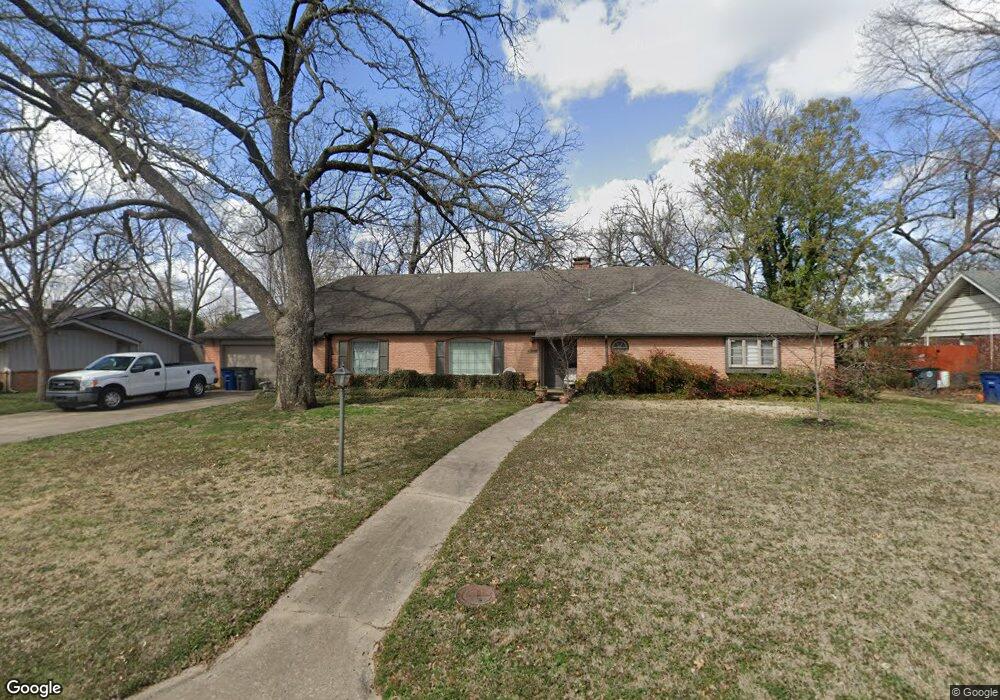
2717 E 57th St Tulsa, OK 74105
South Peoria NeighborhoodEstimated Value: $403,000 - $571,000
3
Beds
3
Baths
2,409
Sq Ft
$202/Sq Ft
Est. Value
About This Home
This home is located at 2717 E 57th St, Tulsa, OK 74105 and is currently estimated at $486,379, approximately $201 per square foot. 2717 E 57th St is a home located in Tulsa County with nearby schools including Carnegie Elementary School, Memorial Middle School, and Memorial High School.
Ownership History
Date
Name
Owned For
Owner Type
Purchase Details
Closed on
Mar 14, 2018
Sold by
Cox Michael J
Bought by
Cox Michael J and The Michael J Cox Trust
Current Estimated Value
Purchase Details
Closed on
Dec 1, 2000
Sold by
Wheaton Loyd D and Wheaton Wanda J
Bought by
Cox Michael J
Purchase Details
Closed on
Nov 19, 1997
Sold by
Bennett Neva L
Bought by
Wheaton Loyd D and Wheaton Wanda J
Purchase Details
Closed on
Sep 29, 1997
Sold by
Bennett Max and Bennett Paula
Bought by
Bennett Neva L
Purchase Details
Closed on
Sep 22, 1997
Sold by
Nelson Tom and Bennett Nelson Melinda Jo
Bought by
Bennett Neva L
Purchase Details
Closed on
Aug 28, 1997
Sold by
Skelly Construction Company Inc
Bought by
Bennett Neva L
Purchase Details
Closed on
Jul 30, 1997
Sold by
Hazelrigg Gary and Bennett Hazelrigg Marcia Loree
Bought by
Bennett Neva L
Create a Home Valuation Report for This Property
The Home Valuation Report is an in-depth analysis detailing your home's value as well as a comparison with similar homes in the area
Home Values in the Area
Average Home Value in this Area
Purchase History
| Date | Buyer | Sale Price | Title Company |
|---|---|---|---|
| Cox Michael J | -- | None Available | |
| Cox Michael J | $198,000 | -- | |
| Wheaton Loyd D | $142,500 | Guaranty Abstract Company | |
| Bennett Neva L | -- | Guaranty Abstract Company | |
| Bennett Neva L | -- | Guaranty Abstract Company | |
| Bennett Neva L | -- | Guaranty Abstract Company | |
| Bennett Neva L | -- | Guaranty Abstract Company |
Source: Public Records
Tax History
| Year | Tax Paid | Tax Assessment Tax Assessment Total Assessment is a certain percentage of the fair market value that is determined by local assessors to be the total taxable value of land and additions on the property. | Land | Improvement |
|---|---|---|---|---|
| 2025 | $3,099 | $23,124 | $3,535 | $19,589 |
| 2024 | $2,845 | $23,124 | $3,908 | $19,216 |
| 2023 | $2,845 | $23,421 | $4,231 | $19,190 |
| 2022 | $2,898 | $21,739 | $6,499 | $15,240 |
| 2021 | $2,784 | $21,077 | $6,301 | $14,776 |
| 2020 | $2,746 | $21,077 | $6,301 | $14,776 |
| 2019 | $2,847 | $20,780 | $6,014 | $14,766 |
| 2018 | $2,854 | $20,780 | $6,014 | $14,766 |
| 2017 | $2,822 | $21,589 | $6,248 | $15,341 |
| 2016 | $2,680 | $20,961 | $5,687 | $15,273 |
| 2015 | $2,603 | $20,350 | $6,303 | $14,047 |
| 2014 | $2,578 | $20,350 | $6,303 | $14,047 |
Source: Public Records
Map
Nearby Homes
- 2706 E 57th St
- 2601 E 57th St
- 2528 E 57th St
- 5644 S Delaware Ave
- 5534 S Columbia Ave
- 6013 S Atlanta Ave Unit 2
- 5922 S Atlanta Place Unit 2
- 2709 E 61st St
- 5819 S Delaware Place
- 5519 S Atlanta Ave Unit 24
- 2926 E 57th Place
- 2943 E 56th Place
- 2202 E 55th Ct Unit 2202`
- 2995 E 56th Place
- 2130 E 60th St Unit I3
- 5633 S Yorktown Place
- 2124 E 60th Ct Unit O-4
- 2130 E 59th St Unit 3
- 5127 S Columbia Ave
- 2112 E 60th St Unit J6
- 2727 E 57th St
- 2707 E 57th St
- 2702 E 56th Place
- 2702 E 56th Place
- 2714 E 57th St
- 2710 E 56th Place
- 2724 E 57th St
- 2735 E 57th St
- 2607 E 57th St
- 2714 E 56th Place
- 2732 E 57th St
- 2639 E 57th Place
- 2647 E 57th Place
- 2745 E 57th St
- 2631 E 57th Place
- 2718 E 56th Place
- 5707 S Birmingham Ave
- 5706 S Columbia Place
- 2655 E 57th Place
- 2621 E 57th Place
Your Personal Tour Guide
Ask me questions while you tour the home.