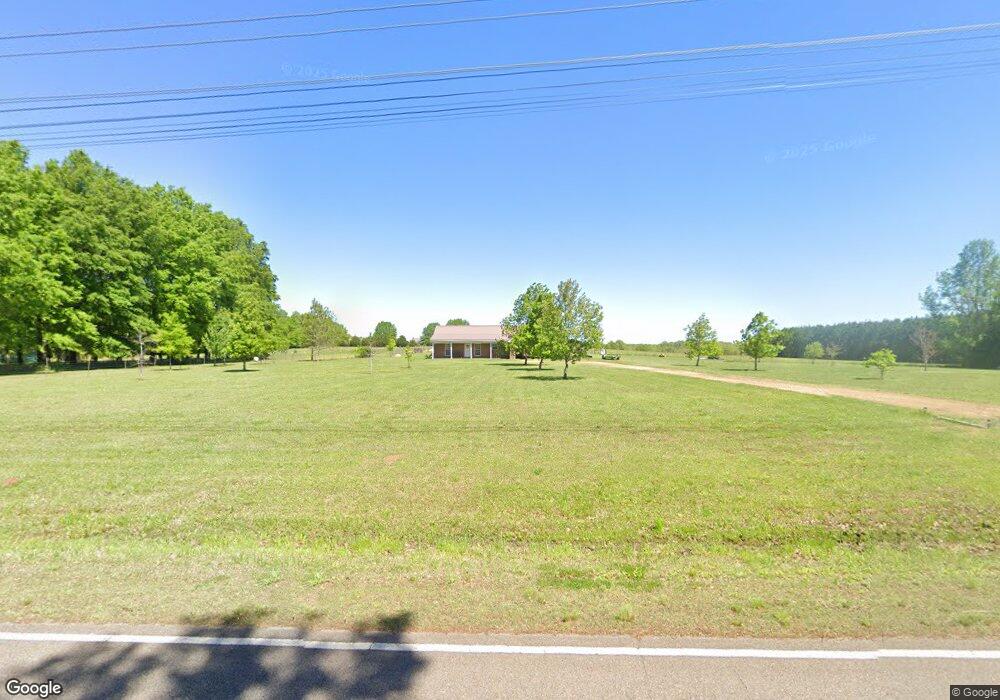
2717 E Tibbee Rd West Point, MS 39773
Estimated Value: $63,901 - $146,000
2
Beds
--
Bath
800
Sq Ft
$143/Sq Ft
Est. Value
About This Home
This home is located at 2717 E Tibbee Rd, West Point, MS 39773 and is currently estimated at $114,225, approximately $142 per square foot. 2717 E Tibbee Rd is a home located in Clay County with nearby schools including East Side Elementary School, West Clay Elementary School, and Church Hill Elementary School.
Create a Home Valuation Report for This Property
The Home Valuation Report is an in-depth analysis detailing your home's value as well as a comparison with similar homes in the area
Tax History
| Year | Tax Paid | Tax Assessment Tax Assessment Total Assessment is a certain percentage of the fair market value that is determined by local assessors to be the total taxable value of land and additions on the property. | Land | Improvement |
|---|---|---|---|---|
| 2025 | $195 | $3,472 | $1,410 | $2,062 |
| 2024 | $195 | $3,472 | $1,410 | $2,062 |
| 2023 | $352 | $3,098 | $1,410 | $1,688 |
| 2022 | $171 | $3,098 | $1,410 | $1,688 |
| 2021 | $171 | $3,098 | $1,410 | $1,688 |
| 2020 | $171 | $3,098 | $1,410 | $1,688 |
| 2019 | $162 | $3,083 | $1,410 | $1,673 |
| 2018 | $155 | $3,083 | $1,410 | $1,673 |
| 2017 | $155 | $3,083 | $1,410 | $1,673 |
| 2016 | $150 | $3,083 | $1,410 | $1,673 |
| 2015 | $145 | $2,882 | $1,410 | $1,472 |
| 2014 | $125 | $2,882 | $1,410 | $1,472 |
| 2013 | $125 | $2,882 | $1,410 | $1,472 |
Source: Public Records
Map
Nearby Homes
- 125 Mayfield Dr
- 452 Artesia West Point Rd
- 0 Hwy 45 Alt S Unit 26283174
- 0 Hwy 45 Alt S Unit 26-273
- Tibbee Rd
- 21 Shadowlawn Cove
- 0 Golden Horn Rd
- 0 Waverly Dr
- 207 Country Club Dr
- 9 Scotland Yard
- 43 Garden Cove
- 145 Waverly Dr
- 193 Waverly Dr
- 309 Waverly Dr
- 249 Waverly Dr
- 84 Waverly Dr
- 4132 N Frontage Rd
- 0 Old Tibbee Rd
- 0 Dogwood Dr
- 0 Dogwood Dr (Lot 14) Unit 26-329
- 2681 E Tibbee Rd
- 3406 E Tibbee Rd
- 2745 E Tibbee Rd
- 2793 E Tibbee Rd
- 2754 E Tibbee Rd
- 2730 E Tibbee Rd
- 7315 Billy Coleman Rd
- 3130 E Tibbee Rd
- 7281 Billy Coleman Rd
- 3778 E Tibbee Rd
- 6702 Community Center Rd
- 6640 Community Center Rd
- 3832 E Tibbee Rd
- 2801 Community Center Ln
- 120 Community Center Ln
- 3619 E Tibbee Rd
- 180 Community Center Ln
- 2976 Bennett Rd
- 3847 E Tibbee Rd
- 3848 E Tibbee Rd
Your Personal Tour Guide
Ask me questions while you tour the home.