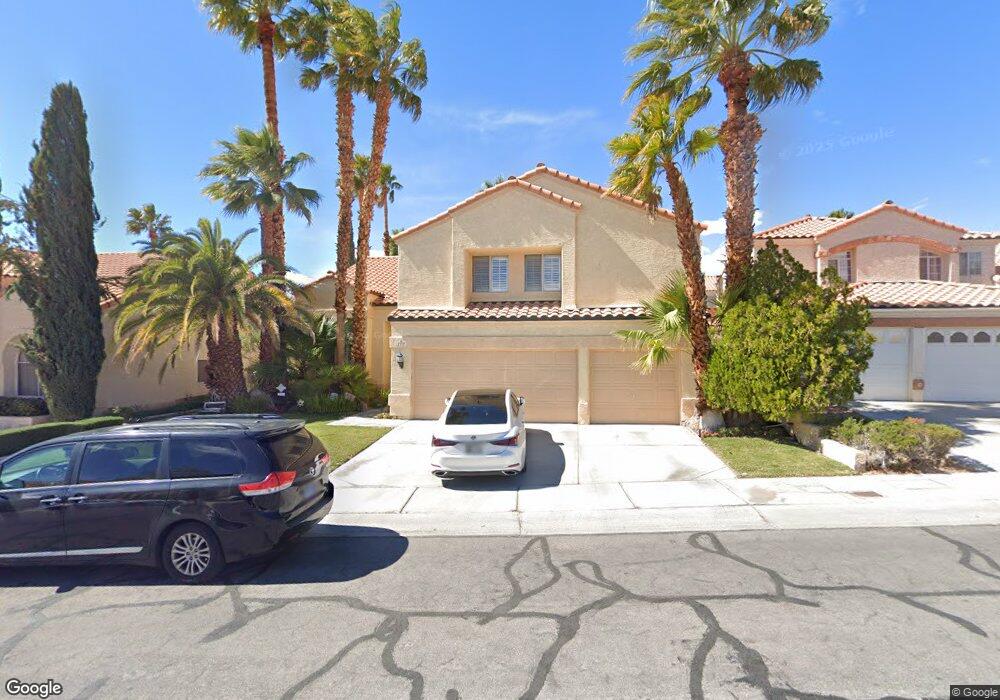
2717 Monrovia Dr Unit 2 Las Vegas, NV 89117
The Section Seven NeighborhoodEstimated Value: $665,919 - $792,000
6
Beds
3
Baths
2,951
Sq Ft
$254/Sq Ft
Est. Value
About This Home
This home is located at 2717 Monrovia Dr Unit 2, Las Vegas, NV 89117 and is currently estimated at $748,480, approximately $253 per square foot. 2717 Monrovia Dr Unit 2 is a home located in Clark County with nearby schools including D'Vorre & Hal Ober Elementary School, Victoria Fertitta Middle School, and Bonanza High School.
Ownership History
Date
Name
Owned For
Owner Type
Purchase Details
Closed on
Oct 22, 2013
Sold by
Saham Tamir and Saham Revital
Bought by
Saham Tamir and Saham Revital
Current Estimated Value
Purchase Details
Closed on
Jul 24, 2001
Sold by
Saham Joe I and Saham Miryam
Bought by
Saham Tamir and Saham Revital
Home Financials for this Owner
Home Financials are based on the most recent Mortgage that was taken out on this home.
Original Mortgage
$198,400
Outstanding Balance
$76,514
Interest Rate
7.15%
Estimated Equity
$671,966
Purchase Details
Closed on
Jul 1, 1994
Sold by
Yue A J
Bought by
Saham Joe I and Saham Miryam
Home Financials for this Owner
Home Financials are based on the most recent Mortgage that was taken out on this home.
Original Mortgage
$198,000
Interest Rate
8.38%
Create a Home Valuation Report for This Property
The Home Valuation Report is an in-depth analysis detailing your home's value as well as a comparison with similar homes in the area
Home Values in the Area
Average Home Value in this Area
Purchase History
| Date | Buyer | Sale Price | Title Company |
|---|---|---|---|
| Saham Tamir | -- | None Available | |
| Saham Tamir | $248,000 | Nevada Title Company | |
| Saham Joe I | $220,000 | Old Republic Title Company |
Source: Public Records
Mortgage History
| Date | Status | Borrower | Loan Amount |
|---|---|---|---|
| Open | Saham Tamir | $198,400 | |
| Closed | Saham Joe I | $198,000 |
Source: Public Records
Tax History Compared to Growth
Tax History
| Year | Tax Paid | Tax Assessment Tax Assessment Total Assessment is a certain percentage of the fair market value that is determined by local assessors to be the total taxable value of land and additions on the property. | Land | Improvement |
|---|---|---|---|---|
| 2025 | $3,782 | $130,431 | $42,350 | $88,081 |
| 2024 | $3,673 | $130,431 | $42,350 | $88,081 |
| 2023 | $3,673 | $126,427 | $42,000 | $84,427 |
| 2022 | $3,401 | $108,780 | $30,800 | $77,980 |
| 2021 | $3,149 | $102,936 | $28,350 | $74,586 |
| 2020 | $2,921 | $102,142 | $27,650 | $74,492 |
| 2019 | $2,738 | $97,405 | $23,450 | $73,955 |
| 2018 | $2,612 | $94,100 | $22,750 | $71,350 |
| 2017 | $3,113 | $94,947 | $22,050 | $72,897 |
| 2016 | $2,445 | $90,101 | $16,800 | $73,301 |
| 2015 | $2,440 | $74,017 | $11,900 | $62,117 |
| 2014 | $2,364 | $69,976 | $8,750 | $61,226 |
Source: Public Records
Map
Nearby Homes
- 2724 Monrovia Dr
- 2728 Monrovia Dr
- 2729 Beachside Ct
- 9544 Lazy River Dr
- 9708 Blazing Star Ct
- 2300 Storkspur Way
- 9724 Cascade Falls Ave
- 2821 Willow Wind Ct
- 3001 Bridge Creek St
- 9713 Cascade Falls Ave
- 2704 Messina Ct
- 2112 Preakness Pass Unit A
- 2112 Marble Gorge Dr
- 9429 Abalone Way
- 2909 Ivory Reef Ct
- 2153 Jade Creek St Unit 106
- 2152 Quarry Ridge St Unit 207
- 9717 Sierra Mesa Ave
- 9605 Blowing Sand Cir
- 9624 Beach Water Cir
- 2721 Monrovia Dr
- 2713 Monrovia Dr
- 2716 Beachside Ct
- 2720 Beachside Ct
- 2725 Monrovia Dr
- 2709 Monrovia Dr
- 2712 Beachside Ct
- 2724 Beachside Ct
- 2716 Monrovia Dr
- 2712 Monrovia Dr Unit 2
- 2720 Monrovia Dr
- 0 Monrovia Dr
- 2708 Monrovia Dr
- 2729 Monrovia Dr
- 2705 Monrovia Dr
- 2728 Beachside Ct Unit 2
- 2704 Monrovia Dr
- 2704 Beachside Ct
- 2717 Beachside Ct