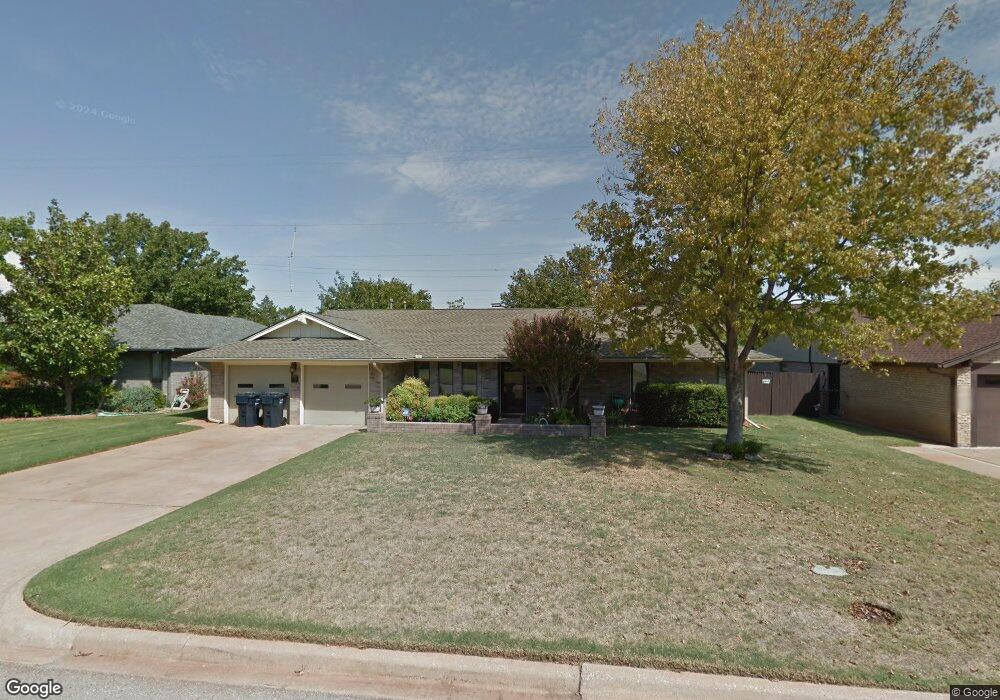
2717 NW 115th St Oklahoma City, OK 73120
Camelot Bel-Aire NeighborhoodEstimated Value: $206,734 - $245,000
3
Beds
2
Baths
1,539
Sq Ft
$148/Sq Ft
Est. Value
About This Home
This home is located at 2717 NW 115th St, Oklahoma City, OK 73120 and is currently estimated at $228,184, approximately $148 per square foot. 2717 NW 115th St is a home located in Oklahoma County with nearby schools including Quail Creek Elementary School, John Marshall Enterprise Middle School, and John Marshall Enterprise High School.
Ownership History
Date
Name
Owned For
Owner Type
Purchase Details
Closed on
Apr 27, 2007
Sold by
Mclean Stephen and Mclean Sarah
Bought by
Ladymon Robert
Current Estimated Value
Home Financials for this Owner
Home Financials are based on the most recent Mortgage that was taken out on this home.
Original Mortgage
$87,500
Outstanding Balance
$53,107
Interest Rate
6.13%
Mortgage Type
Purchase Money Mortgage
Estimated Equity
$175,077
Purchase Details
Closed on
Jul 31, 2003
Sold by
Haggard J Earle
Bought by
Mclean Sarah
Purchase Details
Closed on
Jul 7, 2000
Sold by
Smith Deanna M and Smith Billy J
Bought by
Haggard J Earl
Home Financials for this Owner
Home Financials are based on the most recent Mortgage that was taken out on this home.
Original Mortgage
$69,600
Interest Rate
8.56%
Purchase Details
Closed on
Dec 15, 1998
Sold by
Hall Robert R and Hall Margaret A
Bought by
Smith Deanna M
Create a Home Valuation Report for This Property
The Home Valuation Report is an in-depth analysis detailing your home's value as well as a comparison with similar homes in the area
Home Values in the Area
Average Home Value in this Area
Purchase History
| Date | Buyer | Sale Price | Title Company |
|---|---|---|---|
| Ladymon Robert | $125,000 | Lawyers Title Of Ok City Inc | |
| Mclean Sarah | $97,000 | Stewart Abstract & Title Of | |
| Haggard J Earl | $87,000 | First American Title & Tr Co | |
| Smith Deanna M | $76,000 | -- |
Source: Public Records
Mortgage History
| Date | Status | Borrower | Loan Amount |
|---|---|---|---|
| Open | Ladymon Robert | $87,500 | |
| Previous Owner | Haggard J Earl | $69,600 | |
| Closed | Haggard J Earl | $8,700 |
Source: Public Records
Tax History Compared to Growth
Tax History
| Year | Tax Paid | Tax Assessment Tax Assessment Total Assessment is a certain percentage of the fair market value that is determined by local assessors to be the total taxable value of land and additions on the property. | Land | Improvement |
|---|---|---|---|---|
| 2024 | $1,745 | $15,661 | $2,711 | $12,950 |
| 2023 | $1,745 | $15,204 | $2,866 | $12,338 |
| 2022 | $1,619 | $14,761 | $3,055 | $11,706 |
| 2021 | $1,569 | $14,332 | $2,944 | $11,388 |
| 2020 | $1,538 | $13,915 | $3,039 | $10,876 |
| 2019 | $1,506 | $13,652 | $2,901 | $10,751 |
| 2018 | $1,390 | $13,255 | $0 | $0 |
| 2017 | $1,433 | $13,639 | $2,712 | $10,927 |
| 2016 | $1,421 | $13,529 | $2,712 | $10,817 |
| 2015 | $1,425 | $13,443 | $2,712 | $10,731 |
| 2014 | $1,398 | $13,283 | $2,712 | $10,571 |
Source: Public Records
Map
Nearby Homes
- 11372 Benttree Cir Unit 11372
- 11306 Benttree Cir
- 11540 N May Ave Unit 108E
- 11314 Benttree Cir Unit 11314
- 11307 Benttree Cir Unit 11307
- 11520 N May Ave Unit C101
- 11520 N May Ave Unit C 105
- 2728 Camelot Dr
- 11417 N May Ave Unit B
- 11417 N May Ave Unit D
- 2741 NW 110th St
- 11333 N May Ave Unit 11333
- 11604 N Victoria Dr
- 11413 N May Ave Unit B
- 11327 N May Ave Unit C
- 11325 N May Ave Unit A
- 11325 N May Ave Unit D
- 2821 NW 117th St
- 2524 NW 116th St
- 11309 Leaning Elm Rd
- 2713 NW 115th St
- 2721 NW 115th St
- 2709 NW 115th St
- 2828 NW 115th Place
- 2824 NW 115th Place
- 11508 N Miller Ave
- 11412 Benttree Cir
- 2705 NW 115th St
- 11509 N Miller Ave
- 2632 NW 115th Place
- 11416 Benttree Cir Unit 11416
- 11410 Benttree Cir
- 11504 N Miller Ave
- 11414 Benttree Cir Unit 11414
- 11408 Benttree Cir Unit 11408
- 2704 NW 115th St
- 2836 NW 115th Place
- 11505 N Miller Ave
- 2832 NW 115th Place