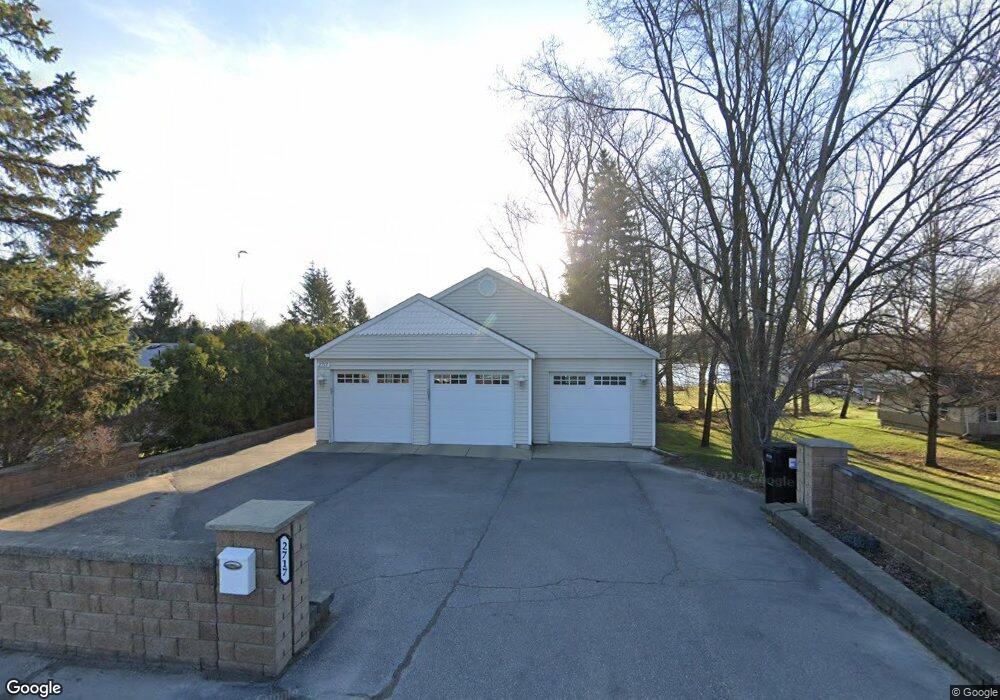
2717 S Hacker Rd Brighton, MI 48114
Estimated Value: $394,000 - $681,000
3
Beds
2
Baths
1,716
Sq Ft
$306/Sq Ft
Est. Value
About This Home
This home is located at 2717 S Hacker Rd, Brighton, MI 48114 and is currently estimated at $524,886, approximately $305 per square foot. 2717 S Hacker Rd is a home located in Livingston County with nearby schools including Three Fires Elementary, Parker Middle School, and Howell High School.
Ownership History
Date
Name
Owned For
Owner Type
Purchase Details
Closed on
May 14, 2020
Sold by
Bastianelli Brian
Bought by
Bastianelli Holly L
Current Estimated Value
Purchase Details
Closed on
Sep 1, 2017
Sold by
Bastianelli Brian
Bought by
Bastianelli Brian and Bastianelli Holly
Purchase Details
Closed on
Mar 5, 2002
Sold by
Selva Gary and Selva Dawn A
Bought by
Bastianelli Brian
Purchase Details
Closed on
Aug 24, 2000
Sold by
Haas John C and Schmoekel Renee J
Bought by
Selva Gary and Selva Dawn A
Home Financials for this Owner
Home Financials are based on the most recent Mortgage that was taken out on this home.
Original Mortgage
$140,000
Interest Rate
11.12%
Purchase Details
Closed on
Sep 29, 1999
Sold by
Matlock Patrick A and Matlock Mary L
Bought by
Haas John and Schmoekel Renee
Purchase Details
Closed on
Sep 8, 1994
Sold by
Coykendall Jeffrey K
Bought by
Haas John C
Create a Home Valuation Report for This Property
The Home Valuation Report is an in-depth analysis detailing your home's value as well as a comparison with similar homes in the area
Home Values in the Area
Average Home Value in this Area
Purchase History
| Date | Buyer | Sale Price | Title Company |
|---|---|---|---|
| Bastianelli Holly L | -- | None Available | |
| Bastianelli Brian | -- | None Available | |
| Bastianelli Brian | $190,900 | Select Title Company | |
| Selva Gary | $175,000 | American Title Co | |
| Haas John | $262,500 | Metropolitan Title Company | |
| Haas John C | $112,000 | -- |
Source: Public Records
Mortgage History
| Date | Status | Borrower | Loan Amount |
|---|---|---|---|
| Previous Owner | Selva Gary | $140,000 |
Source: Public Records
Tax History
| Year | Tax Paid | Tax Assessment Tax Assessment Total Assessment is a certain percentage of the fair market value that is determined by local assessors to be the total taxable value of land and additions on the property. | Land | Improvement |
|---|---|---|---|---|
| 2025 | $2,343 | $225,200 | $0 | $0 |
| 2024 | $2,276 | $224,000 | $0 | $0 |
| 2023 | $2,174 | $196,600 | $0 | $0 |
| 2022 | $3,403 | $153,700 | $0 | $0 |
| 2020 | $3,403 | $157,900 | $0 | $0 |
| 2019 | $3,768 | $153,700 | $0 | $0 |
| 2018 | $3,655 | $145,200 | $0 | $0 |
| 2017 | $3,648 | $145,200 | $0 | $0 |
| 2016 | $3,663 | $144,100 | $0 | $0 |
| 2014 | $3,550 | $122,410 | $0 | $0 |
| 2012 | $3,550 | $107,160 | $0 | $0 |
Source: Public Records
Map
Nearby Homes
- 7975 Bendix Rd
- 2575 Woodland Cove Dr
- 2772 Tim Ave
- 7706 Gunnison Ct Unit 103
- 8252 Woodland Shore Dr
- 2620 Greg Ave
- 8202 Hyne Rd
- 7401 Herbst Rd
- 8301 Hyne Rd
- 8461 Woodland Shore Dr
- 2670 Spring Grove Dr
- 8783 Skylane Dr
- 3313 Oak Knoll Dr
- 8984 S Christine Dr
- 0 Oak Knoll Dr
- 3660 Chatham Place Unit 14
- 3650 Chatham Place Unit 15
- 3736 Chatham Place Unit 6
- 3736 Chatham Place
- 6915 Rink Dr
- 2727 S Hacker Rd
- 2691 S Hacker Rd
- V/L Hacker Rd
- 2730 S Hacker Rd
- 2730 S Hacker Rd Unit Main
- 2730 S Hacker Rd Unit Brighton Apartment
- 2730 S Hacker Rd Unit Main floor
- 2732 S Hacker Rd Unit Upper level
- 2743 S Hacker Rd
- 2765 S Hacker Rd
- 2598 S Hacker Rd
- 2649 S Hacker Rd
- 2764 S Hacker Rd
- 7960 Bendix Rd
- 0000 Bendix
- 2635 S Hacker Rd
- 2771 S Hacker Rd
- 2781 S Hacker Rd
- 7935 Bendix Rd
- 2791 S Hacker Rd
Your Personal Tour Guide
Ask me questions while you tour the home.