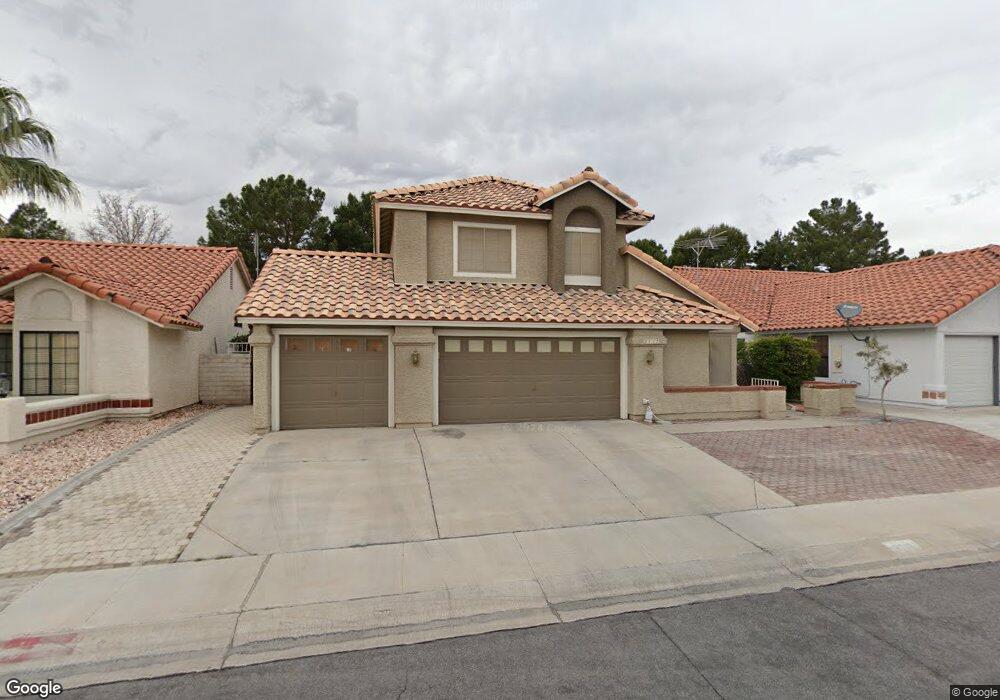
2717 Tidewater Ct Las Vegas, NV 89117
The Lakes NeighborhoodEstimated Value: $547,611 - $622,000
4
Beds
3
Baths
2,366
Sq Ft
$244/Sq Ft
Est. Value
About This Home
This home is located at 2717 Tidewater Ct, Las Vegas, NV 89117 and is currently estimated at $576,903, approximately $243 per square foot. 2717 Tidewater Ct is a home located in Clark County with nearby schools including M J Christensen Elementary School, Clifford J Lawrence Junior High School, and Spring Valley High School.
Ownership History
Date
Name
Owned For
Owner Type
Purchase Details
Closed on
Aug 24, 2007
Sold by
Chen Wenjun
Bought by
Chen Wenjun and Dunshee Lanping
Current Estimated Value
Purchase Details
Closed on
May 4, 2007
Sold by
Burdsall Bradley J and Burdsall Catherine O
Bought by
Chen Wenjun
Home Financials for this Owner
Home Financials are based on the most recent Mortgage that was taken out on this home.
Original Mortgage
$100,000
Outstanding Balance
$60,860
Interest Rate
6.18%
Mortgage Type
Unknown
Estimated Equity
$516,043
Purchase Details
Closed on
Feb 29, 2000
Sold by
Macdonald John A and Macdonald Holly
Bought by
Burdsall Bradley J and Burdsall Catherine O
Home Financials for this Owner
Home Financials are based on the most recent Mortgage that was taken out on this home.
Original Mortgage
$157,050
Interest Rate
7.87%
Create a Home Valuation Report for This Property
The Home Valuation Report is an in-depth analysis detailing your home's value as well as a comparison with similar homes in the area
Home Values in the Area
Average Home Value in this Area
Purchase History
| Date | Buyer | Sale Price | Title Company |
|---|---|---|---|
| Chen Wenjun | -- | None Available | |
| Chen Wenjun | $370,000 | Old Republic Title Co Of Nv | |
| Burdsall Bradley J | $174,500 | Old Republic Title Company |
Source: Public Records
Mortgage History
| Date | Status | Borrower | Loan Amount |
|---|---|---|---|
| Open | Chen Wenjun | $100,000 | |
| Previous Owner | Burdsall Bradley J | $157,050 |
Source: Public Records
Tax History Compared to Growth
Tax History
| Year | Tax Paid | Tax Assessment Tax Assessment Total Assessment is a certain percentage of the fair market value that is determined by local assessors to be the total taxable value of land and additions on the property. | Land | Improvement |
|---|---|---|---|---|
| 2025 | $3,266 | $108,873 | $45,150 | $63,723 |
| 2024 | $3,024 | $108,873 | $45,150 | $63,723 |
| 2023 | $2,014 | $103,486 | $42,000 | $61,486 |
| 2022 | $2,801 | $91,029 | $34,300 | $56,729 |
| 2021 | $2,593 | $87,176 | $32,900 | $54,276 |
| 2020 | $2,405 | $83,886 | $29,750 | $54,136 |
| 2019 | $2,254 | $78,377 | $24,500 | $53,877 |
| 2018 | $2,151 | $80,032 | $28,000 | $52,032 |
| 2017 | $2,536 | $77,339 | $24,150 | $53,189 |
| 2016 | $2,014 | $71,405 | $17,850 | $53,555 |
| 2015 | $2,009 | $59,336 | $14,700 | $44,636 |
| 2014 | $1,947 | $61,842 | $10,500 | $51,342 |
Source: Public Records
Map
Nearby Homes
- 2712 Quail Roost Way
- 2913 Domino Way
- 9113 Anchor Cove Ct
- 8913 Antioch Way
- 8932 Antioch Way
- 9100 Shelter Cove Ct
- 2757 Lodestone Dr Unit 59
- 2761 Lodestone Dr Unit 63
- 2825 Waterview Dr
- 9021 Feather River Ct
- 9429 Abalone Way
- 2200 S Fort Apache Rd Unit 1025
- 2200 S Fort Apache Rd Unit 2202
- 2200 S Fort Apache Rd Unit 1077
- 2200 S Fort Apache Rd Unit 2073
- 2200 S Fort Apache Rd Unit 2237
- 2200 S Fort Apache Rd Unit 2192
- 2200 S Fort Apache Rd Unit 1038
- 2200 S Fort Apache Rd Unit 1050
- 2200 S Fort Apache Rd Unit 1168
- 2721 Tidewater Ct
- 2713 Tidewater Ct
- 2709 Tidewater Ct
- 2725 Tidewater Ct
- 2716 Tidewater Ct
- 2712 Tidewater Ct
- 2705 Tidewater Ct Unit 4
- 2720 Tidewater Ct
- 2729 Tidewater Ct
- 2708 Tidewater Ct
- 2724 Tidewater Ct
- 2701 Tidewater Ct
- 2704 Tidewater Ct
- 2733 Tidewater Ct
- 2708 Quail Roost Way
- 2700 Tidewater Ct
- 2716 Quail Roost Way
- 2728 Tidewater Ct
- 2717 Brookstone Ct
- 2713 Brookstone Ct Unit 3