Estimated Value: $236,864 - $264,000
3
Beds
2
Baths
1,552
Sq Ft
$163/Sq Ft
Est. Value
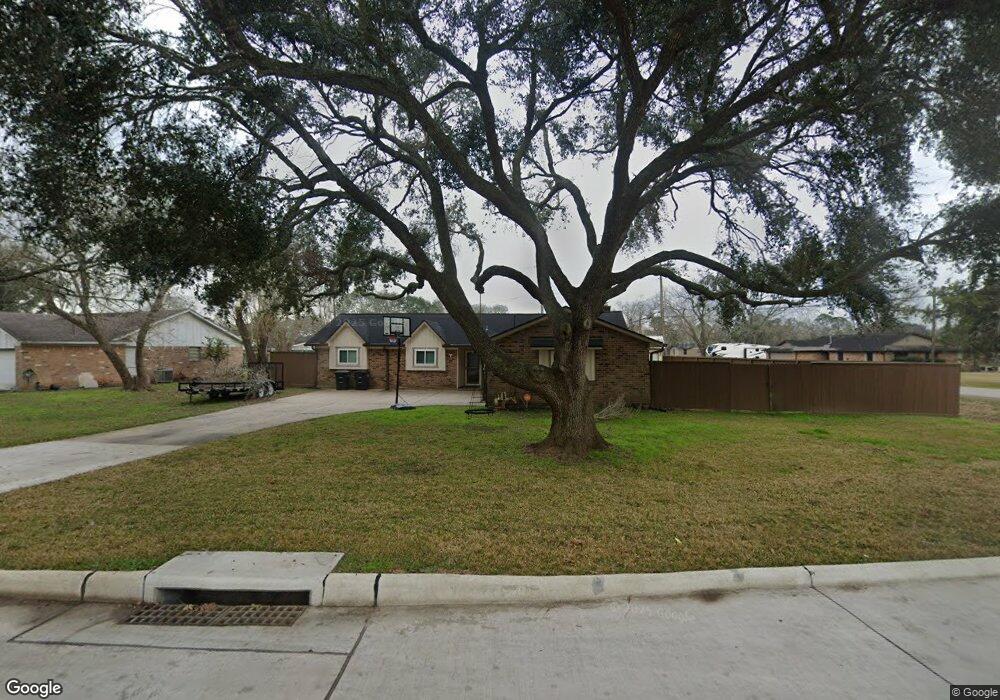
About This Home
This home is located at 2717 Westfield St, Alvin, TX 77511 and is currently estimated at $252,966, approximately $162 per square foot. 2717 Westfield St is a home located in Brazoria County with nearby schools including Alvin Elementary School, Alvin Junior High School, and Alvin High School.
Ownership History
Date
Name
Owned For
Owner Type
Purchase Details
Closed on
Jun 24, 2016
Sold by
C & L Talbot Investments Llc
Bought by
Jackson Travis W
Current Estimated Value
Home Financials for this Owner
Home Financials are based on the most recent Mortgage that was taken out on this home.
Original Mortgage
$152,192
Outstanding Balance
$122,758
Interest Rate
3.99%
Mortgage Type
FHA
Estimated Equity
$130,208
Purchase Details
Closed on
Sep 17, 2010
Sold by
Rouse Donald R and Rouse Lisa M
Bought by
Merryman Lia C
Home Financials for this Owner
Home Financials are based on the most recent Mortgage that was taken out on this home.
Original Mortgage
$118,405
Interest Rate
5.12%
Mortgage Type
FHA
Purchase Details
Closed on
Sep 4, 2009
Sold by
Oliver Charles Ray and Oliver Glenda Kay
Bought by
Rouse Donald R and Rouse Lisa M
Purchase Details
Closed on
Apr 25, 1991
Sold by
Belanger Jamie Irene and Lowe Betty
Bought by
Oliver Charles Ray and Oliver Glenda Kay
Create a Home Valuation Report for This Property
The Home Valuation Report is an in-depth analysis detailing your home's value as well as a comparison with similar homes in the area
Home Values in the Area
Average Home Value in this Area
Purchase History
| Date | Buyer | Sale Price | Title Company |
|---|---|---|---|
| Jackson Travis W | -- | Stewart Title | |
| Merryman Lia C | -- | Alamo Title 4 | |
| Rouse Donald R | $12,000 | None Available | |
| Oliver Charles Ray | -- | -- |
Source: Public Records
Mortgage History
| Date | Status | Borrower | Loan Amount |
|---|---|---|---|
| Open | Jackson Travis W | $152,192 | |
| Previous Owner | Merryman Lia C | $118,405 |
Source: Public Records
Tax History Compared to Growth
Tax History
| Year | Tax Paid | Tax Assessment Tax Assessment Total Assessment is a certain percentage of the fair market value that is determined by local assessors to be the total taxable value of land and additions on the property. | Land | Improvement |
|---|---|---|---|---|
| 2025 | $3,479 | $210,500 | $24,850 | $185,650 |
| 2023 | $3,479 | $213,565 | $26,760 | $197,660 |
| 2022 | $5,325 | $194,150 | $26,760 | $173,860 |
| 2021 | $5,096 | $176,500 | $29,810 | $146,690 |
| 2020 | $4,768 | $162,910 | $25,230 | $137,680 |
| 2019 | $4,530 | $150,820 | $19,110 | $131,710 |
| 2018 | $4,314 | $143,370 | $19,110 | $124,260 |
| 2017 | $4,219 | $138,470 | $19,110 | $119,360 |
| 2016 | $4,032 | $138,470 | $19,110 | $119,360 |
| 2015 | $3,228 | $120,300 | $19,110 | $101,190 |
| 2014 | $3,228 | $116,970 | $19,110 | $97,860 |
Source: Public Records
Map
Nearby Homes
- 2714 Westfield St
- 1902 Westview Dr
- 2609 Adams St
- 2604 Adams St
- 00 Davis Bend County Rd 179 Rd
- 2514 Westfield St
- 000 Corner of County Road 180 and County Road 181 Rd
- 1916 Tracy Lynn Ln
- 3206 Deer Trail Dr
- 2016 W Davis Bend St
- 2609 Quail Run Dr
- 2306 Westfield St
- 221 Magnolia Laurel Dr
- 239 Bay Laurel Ct
- 211 Orchard Laurel Dr
- 220 Magnolia Laurel Dr
- 204 Orchard Laurel Dr
- 243 Bay Laurel Ct
- 230 Magnolia Laurel Dr
- 2408 Chelmsford Ct
- 2713 Westfield St
- 2716 Perry Ln
- 2714 Perry Ln
- 2718 Westfield St
- 2711 Westfield St
- 1960 Rowan Burton Rd
- 1810 Rowan Burton Rd
- 2712 Westfield St
- 2712 Perry Ln
- 1806 Rowan Burton Rd
- 1806 Rowan Burton Rd Unit 1
- 1806 Rowan Burton Rd
- 2709 Westfield St
- 1802 Rowan Burton Rd
- 2710 Perry Ln
- 2713 Perry Ln
- 2710 Westfield St
- 1820 Rowan Burton Rd
- 2711 Perry Ln
- 2707 Westfield St